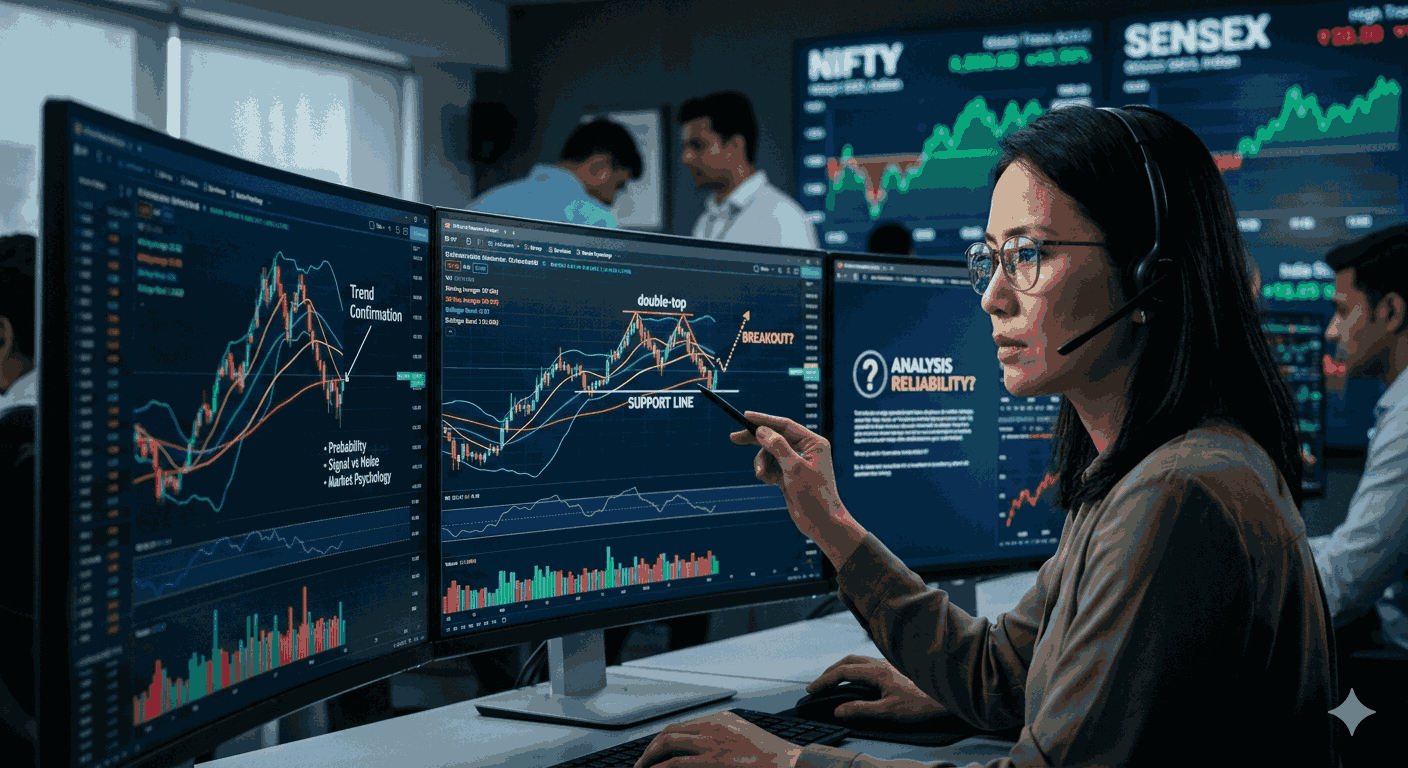

Intraday trading involves buying and selling financial instruments within the same trading session. Since positions are not carried overnight, traders rely heavily on technical analysis and real-time market data to identify profitable opportunities.
One of the most effective ways to analyze short-term market movements is through intraday trading indicators. These indicators help traders identify trends, momentum, volatility, support and resistance levels, and potential entry and exit points.
In this guide, we'll explore the best intraday trading indicators, how they work, and how traders can use them to improve decision-making and risk management.
Intraday trading indicators are mathematical calculations based on price, volume, and market activity. They assist traders in analyzing short-term price movements and identifying potential trading opportunities during market hours.
These indicators help answer important questions such as:
No single indicator guarantees success. Many experienced traders combine multiple indicators to increase the probability of making informed trading decisions.
Intraday trading often involves rapid market movements and frequent decision-making.
Indicators help traders:
Using technical indicators systematically can help traders develop a structured trading approach.
The Relative Strength Index (RSI) is one of the most widely used momentum indicators.
RSI measures the speed and magnitude of price movements on a scale of 0 to 100.
Generally:
RSI works effectively when combined with trend analysis and support-resistance zones.
MACD is a trend-following momentum indicator that helps traders identify changes in trend direction and momentum.
Useful during trending market conditions and breakout scenarios.
VWAP is among the most important indicators used by professional traders and institutions.
VWAP calculates the average trading price weighted by volume throughout the trading day.
Particularly effective for intraday trading and short-term trend analysis.
Bollinger Bands measure market volatility and help identify potential price reversals or breakouts.
Works well in both trending and consolidating markets.
Exponential Moving Averages respond faster to recent price changes than traditional moving averages.
Intraday traders frequently use EMA crossover systems for short-term opportunities.
The Supertrend indicator is widely used for trend-following strategies.
The indicator changes color or position when the trend direction shifts.
Works best during strong directional market movements.
ADX measures trend strength rather than trend direction.
Used alongside trend indicators like EMA and MACD.
The Stochastic Oscillator compares a stock's closing price with its price range over a specific period.
Most effective during sideways or consolidating markets.
Many professional traders avoid relying on a single indicator.
Popular combinations include:
Using multiple indicators can help reduce false signals and improve trade quality.
The ideal indicator depends on your trading style.
| Trading Objective | Suitable Indicator |
|---|---|
| Trend Identification | EMA, VWAP, Supertrend |
| Momentum Analysis | RSI, MACD |
| Volatility Analysis | Bollinger Bands |
| Trend Strength | ADX |
| Reversal Detection | RSI, Stochastic |
| Institutional Price Reference | VWAP |
Indicator overload can create confusion and conflicting signals.
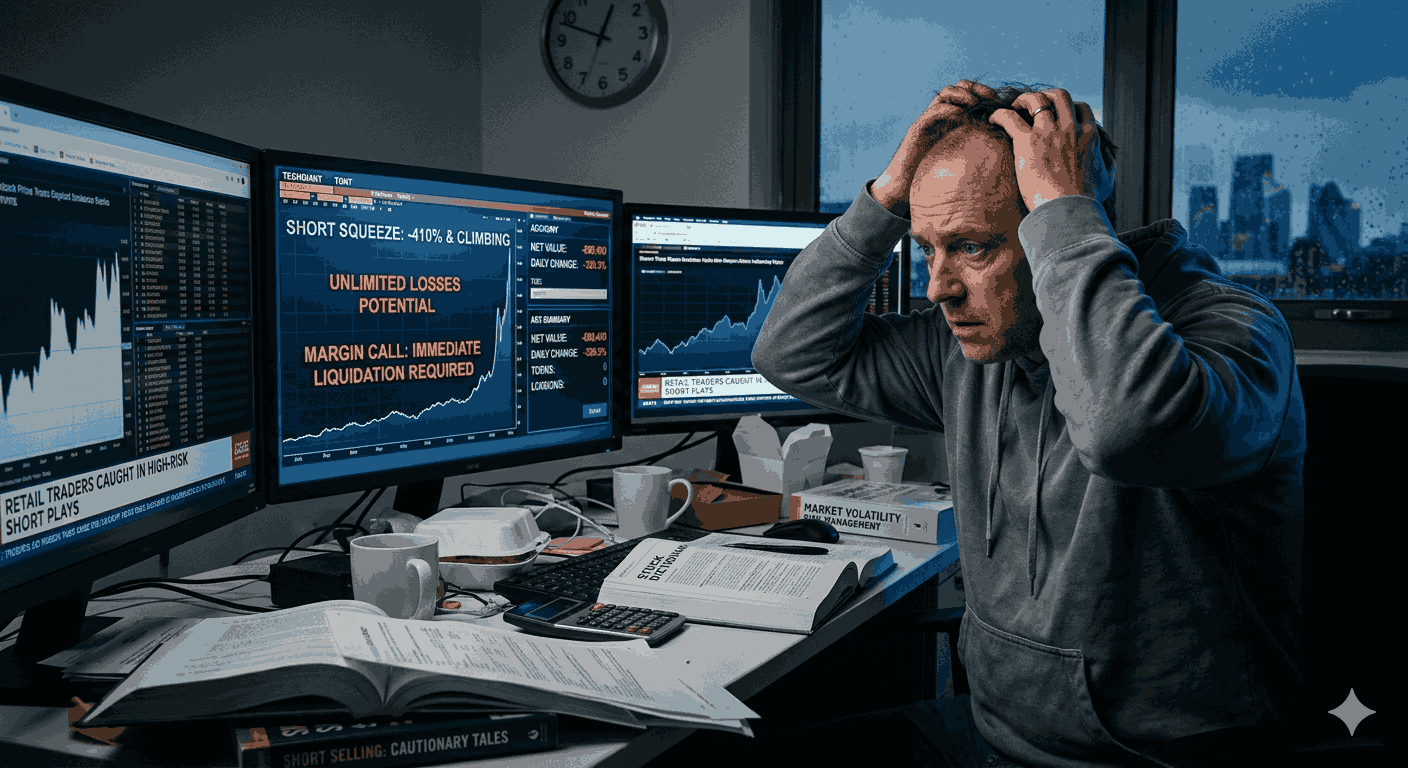
Indicators cannot eliminate market risk.
Not every signal results in a profitable trade.
Broader market trends and news events can significantly impact intraday price movements.
Successful intraday trading depends on more than indicators.
Important practices include:
Even highly accurate indicators cannot guarantee profitable outcomes without disciplined risk management.
There is no universally best indicator. RSI, VWAP, MACD, EMA, and Bollinger Bands are among the most commonly used intraday trading indicators.
Yes. VWAP is widely used by professional and institutional traders to assess price positioning throughout the trading session.
While possible, many traders prefer combining multiple indicators to confirm trading signals and reduce false entries.
EMA, VWAP, Supertrend, and MACD are commonly used for trend identification.
Many traders use the default 14-period RSI, although some adjust settings depending on their trading strategy and timeframe.
Indicators provide probability-based signals rather than guaranteed outcomes. Their effectiveness depends on market conditions and how they are applied.
Intraday trading indicators play an important role in helping traders analyze market trends, momentum, volatility, and potential entry and exit opportunities. Indicators such as RSI, MACD, VWAP, Bollinger Bands, EMA, Supertrend, ADX, and Stochastic Oscillator each provide unique insights into market behavior.
However, no indicator should be used in isolation. Combining indicators with sound risk management, market awareness, and trading discipline can help traders make more informed decisions and improve consistency over time.
Understanding how each indicator works and applying them appropriately can significantly enhance an intraday trader's analytical framework and decision-making process.