
 Aug-17-2026
Intraday trading can move fast. A trade that looks profitable at one moment can turn against you within minutes. This is why deciding where to exit a losing trade is just as important as choosing the right entry.
A stop loss is a predefined price level at which a trader plans to exit a position if the market moves in the wrong direction. Its main purpose is not to guarantee a profitable trade but to keep an individual loss within a manageable limit.
The right stop loss should not be selected randomly. Traders can calculate it using price levels, volatility, percentage-based rules, technical indicators and the amount of capital they are willing to risk.
A stop loss is an exit level set below or above the entry price depending on the direction of the trade.
For a long position, the stop loss is generally below the entry price.
For a short position, it is generally above the entry price.
Suppose you buy a stock at ₹500 and decide that you do not want to remain in the trade if the price falls below ₹490.
Your stop loss is ₹490.
The maximum planned price risk is:
₹500 − ₹490 = ₹10 per share
If you bought 100 shares, the planned trading loss would be approximately:
₹10 × 100 = ₹1,000
This calculation excludes brokerage, taxes, slippage and other transaction costs.
Intraday traders often use leverage and take positions for relatively small price movements. Even a modest adverse move can therefore have a meaningful impact on trading capital.
A stop loss helps traders:
A stop loss does not guarantee execution at the exact trigger price, particularly during sharp market movements. It should therefore be considered a risk-control mechanism rather than complete protection against losses.
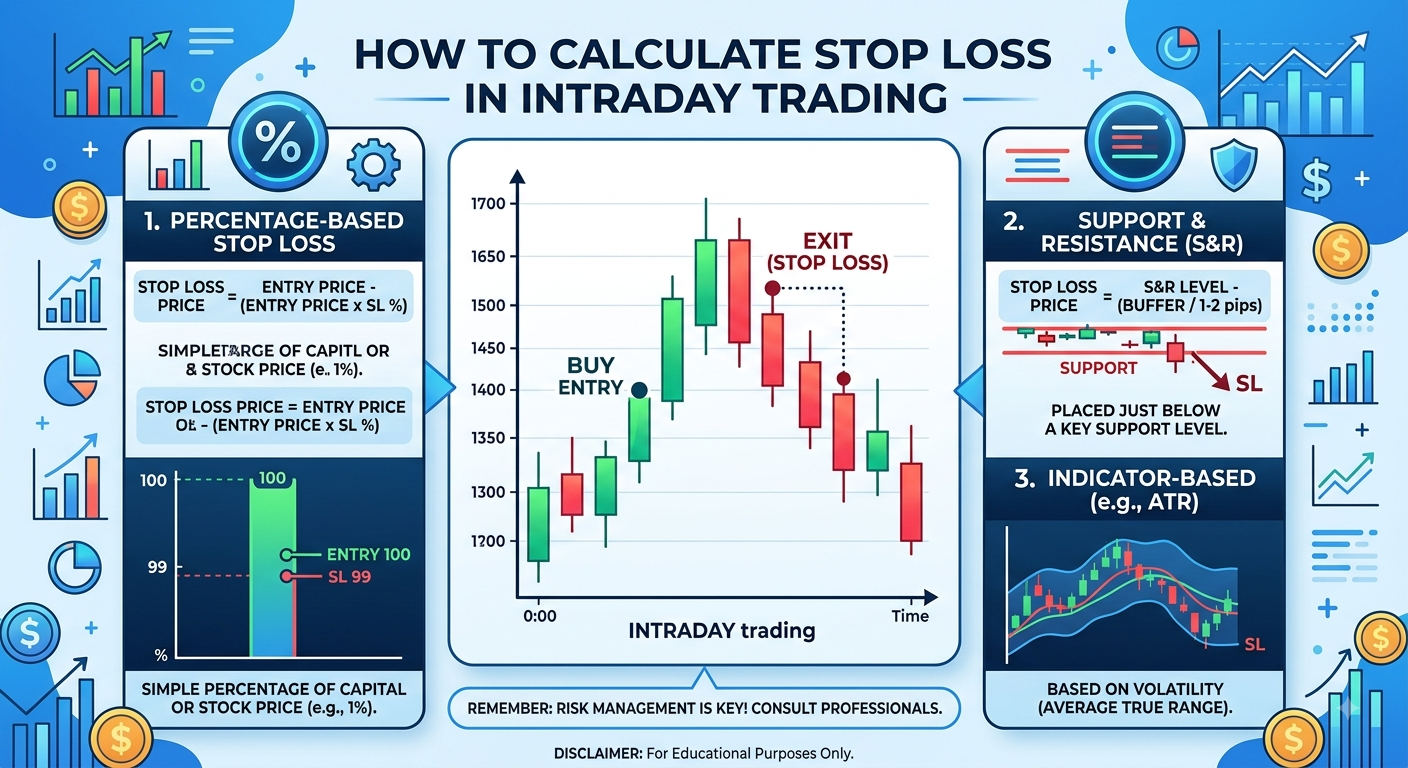
There is no single stop-loss formula suitable for every stock and every market condition. Different methods can be used depending on the trading strategy.
Some commonly used approaches are:
Let's understand each one.
This is one of the simplest methods.
A trader decides the maximum percentage movement allowed against the position.
For a long position:
Stop Loss = Entry Price − (Entry Price × Stop Loss Percentage)
Suppose:
The stop-loss amount is:
₹1,000 × 1% = ₹10
Therefore:
Stop Loss = ₹990
If the stock falls to the chosen stop-loss level, the trader exits according to the trading plan.
For a short trade, the calculation works in the opposite direction.
Suppose:
The stop loss would be:
₹1,000 + ₹10 = ₹1,010
The percentage method is simple, but it does not consider the normal volatility of the stock.
Technical traders frequently place stop losses around important support and resistance levels.
Suppose a stock is trading at ₹520 and has repeatedly found support around ₹510.
A trader entering near ₹520 may place the stop loss slightly below the support level, depending on the strategy.
For example:
If the stock breaks decisively below the support area, the original bullish trade setup may no longer be valid.
Suppose:
If the price moves above resistance, the bearish setup may have failed.
This method links the stop loss to market structure rather than an arbitrary percentage.
This approach starts with the amount of capital a trader is willing to lose on one trade.
Suppose:
Maximum capital risk:
₹2,00,000 × 1% = ₹2,000
Risk per share:
₹500 − ₹495 = ₹5
Position size:
₹2,000 ÷ ₹5 = 400 shares
Therefore, the trader can take a position of 400 shares if the objective is to keep the planned price risk around ₹2,000.
This method connects the stop loss directly with position sizing and overall capital management.
The Average True Range (ATR) is a technical indicator used to measure market volatility.
A stock with a high ATR generally experiences wider price movements than one with a low ATR.
Instead of using the same percentage for every stock, traders can use ATR to adjust the stop loss according to volatility.
Suppose:
Stop-loss distance:
₹8 × 1.5 = ₹12
For a long position:
₹750 − ₹12 = ₹738
For a short position:
₹750 + ₹12 = ₹762
ATR-based stops can help prevent normal intraday price fluctuations from triggering an unnecessarily tight exit.
However, the ATR multiplier should be selected according to the trading strategy and tested rather than used blindly.
Moving averages can also act as dynamic support or resistance.
Intraday traders may monitor shorter-period moving averages or exponential moving averages depending on their strategy.
Suppose a trader buys a stock at ₹640 while the relevant moving average is around ₹630.
The trader may decide that a sustained move below the moving average invalidates the setup and place the stop loss accordingly.
The advantage is that the reference level changes as the market moves.
However, moving averages are lagging indicators and can produce frequent false signals in sideways markets.
Short-term traders sometimes use recent candle highs and lows to define risk.
For a long trade, the stop loss may be placed below the low of the setup candle.
For a short trade, it may be placed above the high.
Suppose:
A trader may place the stop loss around or slightly below ₹404, depending on the setup.
This method is commonly used in breakout and price-action strategies.
Consider a trader with ₹5,00,000 of trading capital.
The trader decides to risk no more than 0.5% on one trade.
Maximum risk:
₹5,00,000 × 0.5% = ₹2,500
The trader identifies:
Risk per share:
₹1,250 − ₹1,240 = ₹10
Position size:
₹2,500 ÷ ₹10 = 250 shares
This means 250 shares would create a planned price risk of approximately ₹2,500 if the stop loss is executed around the intended level.
This approach is generally more structured than first deciding how many shares to buy and then trying to fit a stop loss around the position.
A stop-loss order is an order that becomes active when the security reaches a specified trigger price.
Depending on the available order type, traders may use a stop-loss limit or other supported stop-order mechanism.
It is important to understand that the trigger price and execution price are not necessarily the same.
During fast market movements, sufficient liquidity may not be available at the desired price.
Slippage occurs when the actual execution price differs from the expected price.
For example, suppose your planned exit is ₹495.
A sudden market decline may cause the available execution price to be lower than expected.
Therefore, the actual loss may exceed the amount originally calculated.
Slippage risk can increase during:
A stop loss becomes more useful when considered together with a profit target.
Suppose:
Potential risk:
₹500 − ₹490 = ₹10
Potential reward:
₹520 − ₹500 = ₹20
The risk-reward relationship is therefore:
Risk : Reward = 1 : 2
This means the trader is risking ₹1 for a potential ₹2 reward.
A favourable risk-reward ratio does not guarantee profitability. The strategy's win rate, trading costs and execution quality also matter.
A fixed stop loss remains at the original level unless the trader manually changes it.
Example:
The stop remains at ₹490 even if the stock rises to ₹520.
A trailing stop is moved in the direction of a profitable trade to protect part of the accumulated gain.
For example:
The exact trailing method depends on the trading strategy.
The key principle is that a protective trailing stop is generally moved in the direction that reduces risk, rather than widened simply because the trade is moving against the trader.
A very small stop loss may be triggered by normal intraday volatility before the expected move begins.
An excessively wide stop can expose the trader to unnecessary losses.
Continuously increasing the permitted loss after entering a trade defeats the purpose of having a stop loss.
Different stocks have different levels of volatility. A 1% stop may be reasonable for one stock and unsuitable for another.
A good stop-loss level can still lead to a large financial loss if the position size is excessive.
A stop-loss order cannot guarantee a clean exit when there are insufficient buyers or sellers.
There is no universal percentage.
The appropriate stop depends on:
Instead of asking whether a 0.5%, 1% or 2% stop is best, traders should focus on identifying the price level at which their original trading setup becomes invalid.
They can then adjust the position size so that the financial loss remains within their risk limit.
Trading without a predefined exit can expose a trader to significantly larger losses than expected.
This becomes particularly important in intraday trading because leverage can magnify price movements.
Even experienced traders cannot predict every market move.
Unexpected events, regulatory announcements, corporate news or global developments can change prices quickly.
Having an exit strategy before entering a position can therefore improve trading discipline.
Before entering an intraday trade, ask:
If these questions cannot be answered before placing the trade, the risk may not be clearly defined.
Calculating a stop loss in intraday trading is not simply about choosing a random percentage below the buying price.
A well-planned stop loss should consider the stock's volatility, technical structure, available trading capital and position size.
Percentage-based stops are easy to understand, while support and resistance, ATR and price-action methods can provide more market-specific levels. Risk-per-trade calculations can then help determine how many shares should be traded.
Most importantly, a stop loss is designed to control risk, not eliminate it. Fast markets, gaps and low liquidity can result in execution at a different price.
Successful risk management therefore involves combining sensible stop-loss placement with appropriate position sizing, disciplined execution and realistic expectations.
A stop loss is a predefined exit level designed to limit the loss if an intraday trade moves against the trader.
For a long trade, subtract 1% of the entry price from the entry price. For a short trade, add 1% to the entry price.
There is no single percentage suitable for every trade. The appropriate level depends on volatility, technical levels, strategy and the trader's risk tolerance.
It may work for certain stocks and strategies but can be too narrow or too wide for others. Market volatility and price structure should also be considered.
An ATR-based stop uses the Average True Range indicator to determine the stop distance according to the stock's recent volatility.
A stop loss defines where a losing trade should be exited, while a target defines where the trader intends to book a profit.
An order may not execute at the expected price during sharp price movements, gaps or periods of poor liquidity.
A trader may use a predefined trailing-stop strategy when the position becomes profitable. Widening the stop merely to avoid booking a loss can significantly increase risk.
A basic formula is:
Position Size = Maximum Amount at Risk ÷ Risk Per Share
A predefined exit strategy is an important risk-management practice in intraday trading because short-term price movements can be rapid and unpredictable.