
Introduction to the Indian Stock Market
The Indian stock market is one of the most dynamic and fastest-growing financial markets in the world. It serves as a crucial platform for companies to raise capital and for investors to generate wealth. Over the years, the market has evolved with improved regulations, technology, and financial products, making it more accessible to retail investors. This introduction provides a detailed overview of the Indian stock market, its key components, working mechanisms, and investment potential.
1. Understanding the Indian Stock Market
The stock market is a marketplace where securities (stocks, bonds, derivatives, etc.) are bought and sold. It acts as an intermediary between companies seeking funds for expansion and investors looking for profitable investment opportunities. Investors can buy shares of publicly traded companies, which represent ownership in the company, allowing them to benefit from price appreciation and dividends.
The Indian stock market operates through two major exchanges:
A. Major Stock Exchanges in India
Both exchanges function under the supervision of SEBI (Securities and Exchange Board of India).
2. Regulatory Framework
The Securities and Exchange Board of India (SEBI) is the regulatory authority that ensures the fair and transparent functioning of the stock market. SEBI’s primary responsibilities include:
SEBI plays a crucial role in maintaining market integrity, ensuring that all participants—retail investors, institutional investors, and foreign investors—can trade in a fair environment.
3. Market Segments
The Indian stock market is divided into two primary segments:
A. Primary Market (IPO Market)
The primary market is where companies raise capital by issuing shares to the public through an Initial Public Offering (IPO). Investors can subscribe to these shares before they get listed on the stock exchange. Once the shares are listed, they can be freely traded in the secondary market.
B. Secondary Market (Stock Trading)
The secondary market is where investors buy and sell shares of listed companies. Prices fluctuate based on demand, supply, company performance, economic factors, and global market trends.
The stock exchanges (NSE & BSE) facilitate transactions electronically, ensuring liquidity and transparency in the market.
4. Stock Market Indices
Stock market indices act as indicators of overall market performance.
These indices help investors analyze market trends and make informed investment decisions.
5. How the Indian Stock Market Works
The Indian stock market operates electronically, with trades executed through brokers. Here’s how it works:
Trading occurs in two major categories:
6. Why Invest in the Indian Stock Market?
Investing in the stock market offers several advantages:
✔ Wealth Creation – Stocks have historically generated higher long-term returns than traditional savings options.
✔ Beating Inflation – Stock market returns generally outperform inflation, preserving purchasing power.
✔ Liquidity – Stocks can be easily bought and sold on stock exchanges.
✔ Portfolio Diversification – Investors can spread risk across different sectors and asset classes.
✔ Participation in Economic Growth – Investing in Indian companies allows investors to benefit from the country’s economic expansion.
However, stock market investments come with risks, and investors must conduct proper research and risk assessment before investing.
7. Key Factors Influencing the Indian Stock Market
Several factors affect the performance of the stock market:
✔ Economic Indicators – GDP growth, inflation, interest rates, and fiscal policies impact stock prices.
✔ Corporate Performance – Earnings reports, dividends, and mergers influence investor sentiment.
✔ Global Markets – International economic trends, foreign investments, and geopolitical events affect Indian markets.
✔ Government Policies – Regulations, tax policies, and monetary policies set by the RBI impact market movements.
8. Challenges & Risks in Stock Market Investing
While investing in the stock market can be profitable, it is essential to understand the risks involved:
✔ Market Volatility – Stock prices fluctuate based on market conditions.
✔ Risk of Losses – Poor investment decisions can lead to capital loss.
✔ Emotional Investing – Fear and greed can lead to impulsive decisions.
✔ Lack of Knowledge – Not understanding market trends can lead to poor investment choices.
Investors should adopt a long-term perspective, diversify investments, and stay informed to mitigate risks.
9. Conclusion
The Indian stock market is a vital financial hub, providing a platform for businesses to raise capital and for investors to grow their wealth. With proper knowledge, risk management, and long-term strategies, stock market investments can yield high returns.
As India continues to expand its economy, the stock market remains a lucrative opportunity for investors. Whether you are a beginner or an experienced trader, understanding market fundamentals is the key to making informed and profitable investment decisions.

Introduction In the dynamic world of stock trading, developing a well-researched point of view is critical for success. Whether you're a seasoned trader or a beginner, Technical Analysis (TA) serves as an invaluable tool in identifying market trends and making informed trading decisions. This blog explores the fundamentals of TA, its assumptions, and practical applications to help you navigate the stock markets efficiently.
What is Technical Analysis? Technical Analysis is a method used to evaluate securities by analyzing price movements and trading volumes. Unlike Fundamental Analysis, which focuses on a company's financials, TA relies on historical price patterns to predict future price movements. It helps traders determine key aspects of a trade, such as:
The ideal entry and exit points
The level of risk involved
The expected reward
The duration for holding a position
Technical Analysis is based on the belief that historical price movements tend to repeat themselves, allowing traders to identify trends and patterns that can be leveraged for profitable trades.
Key Assumptions of Technical Analysis TA operates on several fundamental assumptions:
Market Discounts Everything: All available information, including past price movements and external factors, is already reflected in the stock’s price.
Price Moves in Trends: Once a trend is established, prices are likely to continue moving in that direction until a reversal occurs.
History Tends to Repeat Itself: Market participants often react in similar ways to comparable market situations, creating recognizable price patterns.
Chart Types in Technical Analysis To effectively analyze stock trends, traders use various charting techniques. Some of the most popular types include:
Line Chart: Provides a basic overview of closing prices over a specific time frame.
Bar Chart: Displays open, high, low, and close (OHLC) prices, offering more detailed insights.
Japanese Candlestick Chart: The most widely used chart, providing visual representation of market sentiment and trend direction.
Popular Candlestick Patterns Candlestick patterns play a crucial role in identifying trading opportunities. Here are some key patterns every trader should know:
Marubozu: A candlestick with no upper or lower shadow, indicating strong buying (bullish Marubozu) or selling (bearish Marubozu) pressure.
Doji: A candle where the open and close prices are nearly equal, signaling indecision in the market.
Hammer: A bullish reversal pattern that appears at the bottom of a downtrend.
Shooting Star: A bearish reversal pattern appearing at the top of an uptrend.
How to Use Technical Analysis Effectively? TA is best suited for identifying short-term trading opportunities rather than long-term investments. Here are a few best practices for traders:
Use Multiple Indicators: Relying on a single pattern or indicator can be misleading. Combine different tools like Moving Averages, RSI, and MACD for better accuracy.
Manage Risks Wisely: Always set stop-loss orders to limit potential losses.
Understand Market Sentiment: Recognizing bullish and bearish trends helps in making better trading decisions.
Choose the Right Time Frame: Traders should select time frames that match their trading style, whether it's intraday, short-term, or long-term analysis.
Conclusion Technical Analysis is a powerful approach to trading that helps traders make informed decisions based on historical price data. By understanding patterns, trends, and key indicators, traders can enhance their ability to predict market movements and optimize their trading strategies. While TA does not guarantee success, when combined with proper risk management and discipline, it can significantly improve trading performance.
Stay tuned for more insights from AGSSL, your trusted partner in the stock market journey!

Introduction to Fundamental Analysis
Overview: Fundamental Analysis (FA) is a method used to assess a company’s financial health and long-term growth potential. It involves analyzing financial statements, management quality, industry trends, and macroeconomic factors. Unlike Technical Analysis, which focuses on stock price movements, FA helps investors make informed decisions based on a company's actual performance.
Key Concepts:
Types of Fundamental Analysis:
Becoming a Fundamental Analyst: Anyone with basic financial knowledge and a structured approach can analyze stocks using FA.
Essential Tools for FA:
Mindset of an Investor
Investor vs Trader vs Speculator:
Power of Compounding:
Core-Satellite Investment Strategy:
How to Read an Annual Report
Key Sections in an Annual Report:
Standalone vs Consolidated Financial Reports:
Understanding Corporate Governance:
Understanding Financial Statements
Profit & Loss (P&L) Statement
A report summarizing a company’s financial performance over a given period.
Key Components:
Balance Sheet
A snapshot of a company’s financial position at a specific time.
Key Elements:
Cash Flow Statement
Tracks how cash is generated and used by the company.
Main Sections:
Key Financial Ratios for Analysis:
Investment Decision-Making Using FA
Steps to Analyze a Stock Using Fundamental Analysis:
Common Mistakes to Avoid in FA:
Key Takeaways:

Understanding Futures Trading: A Comprehensive Guide
Futures trading is a fundamental part of financial markets, allowing traders to speculate on the future price movements of various assets. Whether you're an experienced investor or a beginner looking to explore this field, understanding the key concepts of futures trading is essential. This blog provides a detailed breakdown of futures trading, explaining its mechanics, key features, types of contracts, advantages, risks, and strategies.
1. What is Futures Trading?
Futures trading involves buying and selling contracts that commit the trader to buy or sell an underlying asset at a predetermined price on a specified future date. These contracts are standardized and traded on regulated exchanges, making them highly liquid and accessible.
Futures contracts are used for both hedging (risk management) and speculation (profit generation). Traders and investors use futures to protect their portfolios from adverse price movements or to gain from price fluctuations in stocks, indices, commodities, currencies, and interest rates.
2. How Does Futures Trading Work?
Futures trading is based on a contractual agreement between two parties:
Each contract has a specific lot size, expiration date, and settlement process. Since futures contracts are traded on an exchange, they require a margin deposit, which acts as collateral and helps maintain financial security.
Example: If an investor buys a futures contract for gold at ₹1,50,000 per 10 grams and the price rises to ₹1,55,000, they make a profit of ₹5,000 per contract. Conversely, if the price drops to ₹1,45,000, they incur a loss of ₹5,000 per contract.
3. Key Features of Futures Contracts
4. Types of Futures Contracts
Futures contracts cover various asset classes, including:
Each type of futures contract has unique factors influencing its price, such as supply and demand, economic data, and geopolitical events.
5. Benefits of Futures Trading
A. Hedging Against Market Risk
Hedging with futures helps businesses and investors reduce risks associated with price fluctuations. For example, a farmer selling wheat futures at ₹2,500 per quintal can lock in the price, ensuring stability even if market prices drop.
B. High Leverage
Futures trading requires only a margin deposit, allowing traders to control larger positions than their capital would otherwise permit.
C. Market Liquidity
Since futures contracts are actively traded on exchanges, they provide ample liquidity, enabling easy entry and exit of positions.
D. Portfolio Diversification
Investors can diversify their portfolios by trading different types of futures contracts, thereby spreading risk across multiple asset classes.
E. Price Discovery
Futures markets help determine fair prices for underlying assets based on supply, demand, and global economic conditions.
6. Risks of Futures Trading
A. Leverage Risk
While leverage can amplify profits, it can also lead to significant losses if the market moves against a trader’s position.
B. Price Volatility
Futures markets are highly volatile, and price swings can result in substantial losses if not managed properly.
C. Margin Calls
If a trade moves against a trader’s position, they may receive a margin call requiring additional funds to maintain their position.
D. Expiration Risk
Futures contracts have fixed expiry dates, and traders must either roll over their contracts or settle them before expiration.
E. Liquidity Risk
Some contracts may have lower liquidity, making it harder to exit positions quickly without significant price slippage.
7. Trading Strategies in Futures Markets
A. Trend Following
Traders use technical indicators like moving averages to identify trends and trade in the direction of the market.
B. Spread Trading
This strategy involves buying and selling related futures contracts to profit from price differences.
C. Arbitrage
Traders exploit price differences between futures and spot markets for risk-free profits.
D. Hedging
Institutions and investors use futures to protect against adverse price movements in their portfolios.
E. Scalping
A short-term strategy where traders take advantage of small price movements for quick profits.
F. Swing Trading
Traders hold positions for several days to capitalize on short-term market fluctuations.
8. Regulatory Framework for Futures Trading
Futures trading is governed by strict regulations to ensure transparency and protect investors. Regulatory bodies such as the Securities and Exchange Board of India (SEBI) oversee futures trading in India, while the Commodity Futures Trading Commission (CFTC) regulates futures markets in the U.S.
Regulations include:
9. How to Start Trading Futures?
Step 1: Choose a Reputable Broker
Selecting a SEBI-registered broker with competitive fees and good trading platforms is essential.
Step 2: Open a Trading Account
Traders need to open a futures trading account with a broker and deposit the required margin.
Step 3: Learn Market Fundamentals
Understanding market trends, economic indicators, and technical analysis helps traders make informed decisions.
Step 4: Develop a Trading Plan
A well-defined strategy, including entry and exit points, risk management, and stop-loss orders, is crucial for success.
Step 5: Start with Paper Trading
New traders should practice with a demo account before investing real money.
10. Conclusion
Futures trading is a powerful financial tool used by traders, investors, and businesses for hedging and speculation. While it offers significant opportunities for profit, it also carries inherent risks that require careful management.
To succeed in futures trading, traders should develop a sound strategy, manage risk effectively, and stay updated with market trends. If you are new to futures trading, consider starting with small positions and using risk management techniques to protect your capital.
Options Theory for Professional Trading (Indian Market Edition) 🇮🇳
The Indian stock market offers a variety of options trading opportunities, mainly on NSE (National Stock Exchange) and BSE (Bombay Stock Exchange). This guide will break down options trading in India, including how it works, key strategies, and practical examples based on Indian stocks and indices like Nifty 50, Bank Nifty, and stocks like Reliance, TCS, HDFC Bank, etc.
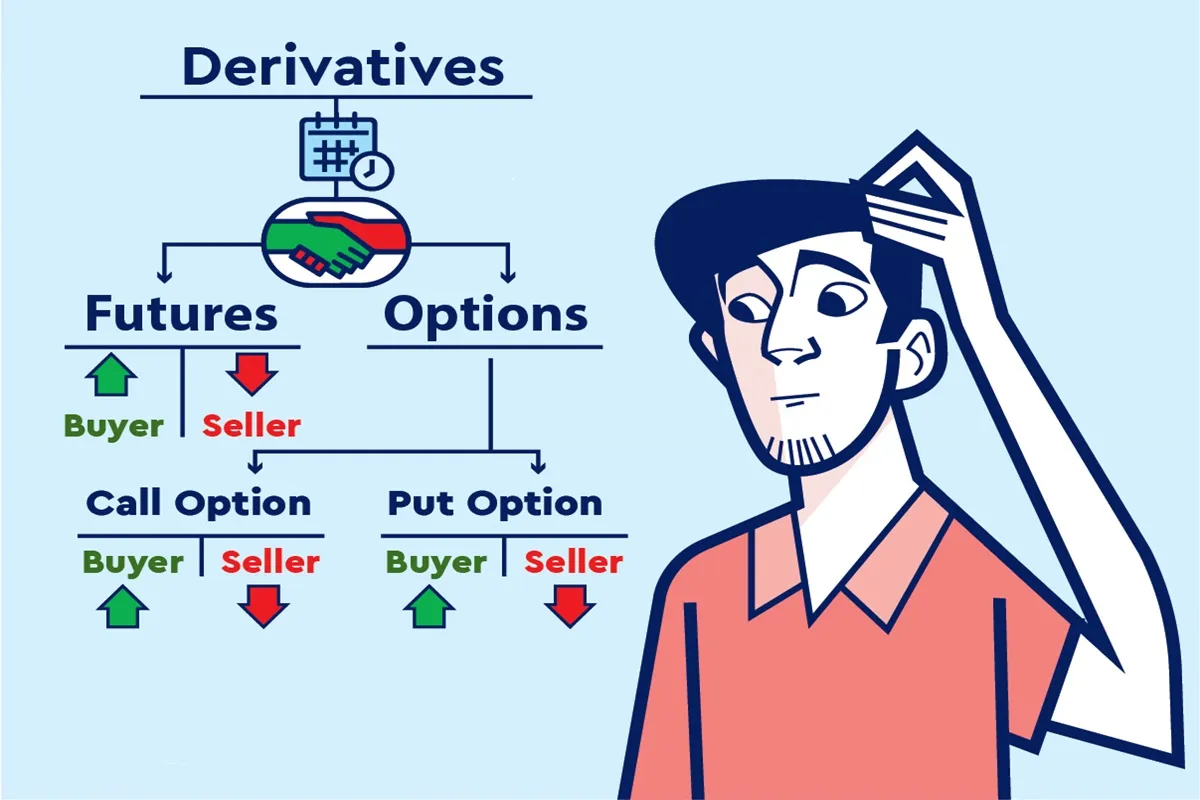
What Are Options in the Indian Market?
Options are derivative contracts that give traders the right, but not the obligation, to buy (Call Option) or sell (Put Option) an asset at a fixed price before the expiry date.
In India, options trading is mainly done on the NSE through F&O (Futures & Options) contracts. The most traded options are:
NIFTY 50 options – Based on the Nifty index
BANK NIFTY options – Based on the Bank Nifty index
Stock options – Available for selected stocks like Reliance, Infosys, HDFC Bank, etc.
Options are used by traders to:
Types of Options in India
Call Option (CE) – The Right to Buy
A Call Option gives you the right to buy an asset at a fixed price.
Example:
Put Option (PE) – The Right to Sell
A Put Option gives you the right to sell an asset at a fixed price.
Example:
Summary:
Important Terms in Options Trading (Indian Market)
Strike Price → The price at which the option can be exercised (e.g., Nifty 22,100 CE).
Premium → The cost of buying an option (changes based on market demand).
Expiry Date → Options expire on the last Thursday of every month (weekly expiries for indices).
Lot Size → You cannot buy 1 option; you must buy in "lots" (e.g., Nifty50 lot = 50 units).
Intrinsic Value → The real value of an option if exercised immediately.
Time Decay (Theta) → Options lose value as expiry nears (affects buyers).
How Traders Use Options in India
Speculators: Traders bet on short-term price movements in stocks or indices.
Hedgers: Investors use options to protect against market losses.
Income Seekers: Selling options generates premium income.
Popular Option Trading Strategies (Indian Market Examples) 🇮🇳
Covered Call (For Extra Income)
Best for: Investors who already own stocks and want to make extra income.
How it works: Sell a Call Option on a stock you own and earn a premium.
Example (HDFC Bank Covered Call)
Protective Put (For Risk Management)
Best for: Protecting stock holdings from a sudden crash.
How it works: Buy a Put Option to hedge against downside risk.
Example (Reliance Protective Put)
Straddle (For Big Movements in Any Direction)
Best for: Trading events like Budget Announcements, RBI Meetings, or Quarterly Results.
How it works: Buy a Call and Put at the same strike price.
Example (Nifty Straddle on RBI Policy Day)
Iron Condor (For Sideways Markets)
Best for: When you think Nifty or Bank Nifty will trade in a range.
How it works: Sell a Call and Put to collect premiums.
Example (Bank Nifty Iron Condor)
What Affects Option Prices in India? (The “Greeks”)
Delta → Measures how much the option price moves when the stock/index price moves.
Theta (Time Decay) → Options lose value as expiry nears (affects option buyers).
Vega → Options prices increase when volatility rises (e.g., before major news events).
Gamma → Measures how fast Delta changes.
Example:
Final Thoughts: Should You Trade Options in India?
Advantages:
Small capital required (compared to stocks).
Can make money in any market direction (up, down, or sideways).
Used by professionals for hedging risks and boosting returns.
Risks:
Options expire worthless if they don’t move in your Favor.
Time decay reduces option prices quickly near expiry.
Selling options carries unlimited risk if not managed properly.
Pro Tips for Indian Traders
Always check liquidity (avoid low-volume stocks).
Be aware of event-based volatility (RBI meetings, elections, budgets).
Manage risk using stop-losses & hedging strategies.

Understanding Currency and Commodity Futures: A Comprehensive Guide
In today's dynamic global economy, understanding financial instruments that help manage risk is crucial for individuals, businesses, and institutions alike. Among these tools, currency futures and commodity futures stand out for their ability to provide hedging, speculative, and arbitrage opportunities. This guide explores what these instruments are, how they work, and why they are vital in the Indian financial landscape.
________________________________________
What Are Currency Futures?
Currency futures are standardized exchange-traded contracts that obligate the buyer to purchase, and the seller to sell, a specific amount of a currency at a predetermined price on a specified future date. These are traded on recognized exchanges like the National Stock Exchange (NSE) and the Bombay Stock Exchange (BSE) in India, and globally on platforms like the Chicago Mercantile Exchange (CME).
Key Features of Currency Futures:
• Standardization: Contract size, maturity date, and tick size are standardized.
• Exchange-Traded: Ensures transparency and reduces counterparty risk.
• Mark-to-Market: Daily settlement of profits and losses ensures real-time accountability.
• Leverage: Traders can control a large position with a relatively small amount of capital.
Example Use Case:
Imagine an Indian importer who is required to pay $100,000 to a U.S. supplier three months from now. If the rupee depreciates against the dollar during this period, the importer will end up paying more in INR. To hedge against this risk, the importer can buy USD-INR futures, locking in the exchange rate.
________________________________________
What Are Commodity Futures?
Commodity futures are contracts to buy or sell a specific quantity of a commodity like gold, crude oil, wheat, or cotton at a future date and price. These are traded on commodity exchanges such as MCX (Multi Commodity Exchange) and NCDEX (National Commodity and Derivatives Exchange) in India.
Key Features of Commodity Futures:
• Physical or Cash Settlement: Depending on the contract, delivery can be physical or settled in cash.
• Hedging Tool: Protects against price volatility in commodities.
• Speculation and Arbitrage: Enables profit from price fluctuations and discrepancies between markets.
• SEBI Regulation: All contracts and participants are governed by the Securities and Exchange Board of India.
Example Use Case:
A cotton farmer anticipates harvesting 10 tons of cotton in the next six months. Concerned about falling prices, the farmer can sell cotton futures today, thus locking in the current favourable price. When harvest time arrives, even if prices fall, the farmer receives the pre-agreed rate.
________________________________________
Purpose and Benefits of Futures Contracts
Whether it’s currency or commodity, futures contracts are used for:
1. Hedging: Protects businesses and investors from adverse price movements.
2. Speculation: Allows traders to profit from expected future price changes.
3. Arbitrage: Takes advantage of price differences across markets.
Who Uses Futures?
• Importers and Exporters: Hedge against exchange rate volatility.
• Farmers and Producers: Secure prices for their goods.
• Investors and Traders: Speculate on price movements.
• Corporates and Institutions: Manage cash flows and financial planning.
________________________________________
Currency Futures vs Commodity Futures: A Comparison
Feature Currency Futures Commodity Futures
Underlying Asset Currencies (USD, EUR, INR) Physical Commodities (Gold, Oil, Wheat)
Purpose Manage forex exposure Manage commodity price risks
Major Users Exporters, Importers, MNCs, Banks Farmers, Traders, Industrial Buyers
Indian Exchanges NSE, BSE MCX, NCDEX
Risk Level Medium Medium to High
Settlement Cash-Settled Cash or Physical
________________________________________
🇮🇳 Futures Trading in the Indian Context
India has seen a steady rise in participation in futures trading. Platforms like MCX for commodities and NSE for currency derivatives offer robust infrastructure and regulatory oversight.
The Securities and Exchange Board of India (SEBI) ensures fair practices, transparency, and investor protection in the derivatives market.
In recent years, Indian investors have shown greater interest in using futures as part of their investment strategies—not just for hedging, but also for diversification and enhanced returns.
________________________________________
Educational Initiatives and Market Awareness
Recognizing the need for informed investors, Indian exchanges and brokers regularly conduct:
• Investor Awareness Programs
• Webinars and Workshops
• Online Simulation Platforms for practice trading
These programs help young traders and retail investors understand the mechanics and risks of futures contracts.
________________________________________
Key Takeaways
• Futures contracts are vital tools for managing financial risk.
• Currency futures protect against foreign exchange volatility.
• Commodity futures help producers and consumers lock in prices.
• Indian exchanges offer transparent, regulated platforms for trading.
• Education and expert guidance are crucial for new investors.
________________________________________
Conclusion
Currency and commodity futures are no longer instruments reserved for large institutions—they are accessible, useful, and increasingly essential for individual investors and small businesses in India. Whether you're an importer hedging currency risk or a farmer securing your product's price, futures offer a way to reduce uncertainty and plan confidently.
As India's financial markets evolve, understanding and leveraging futures trading can offer a significant advantage to proactive investors.
Stay tuned for more deep dives into financial tools and strategies to secure your future in the global economy!
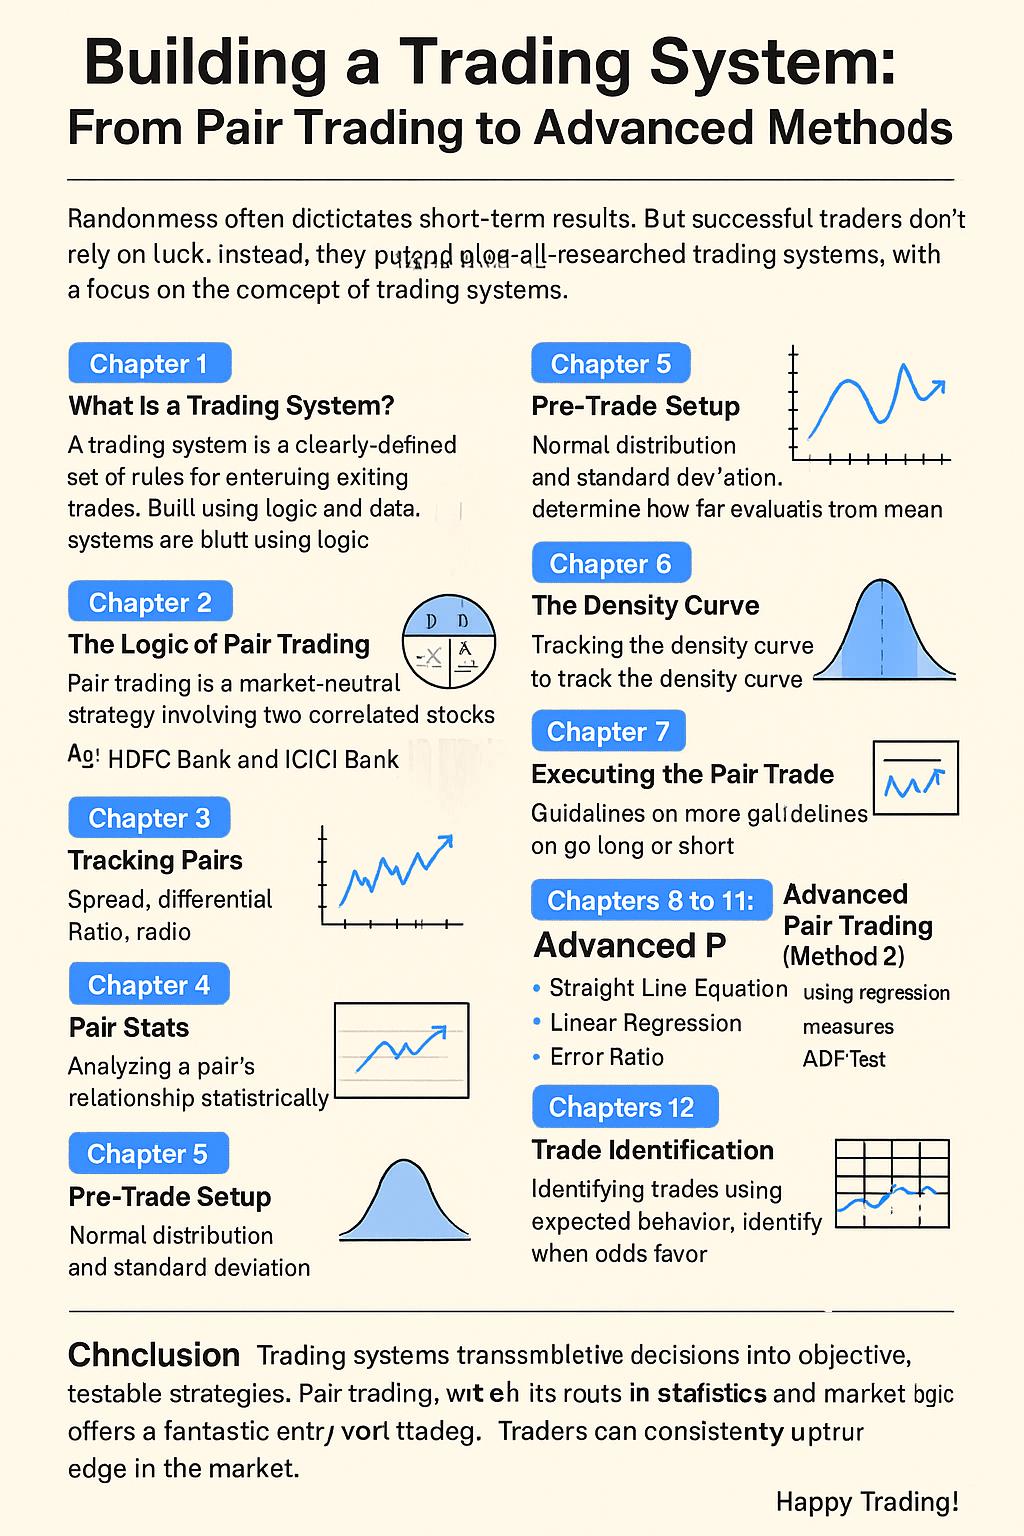
In the world of trading, randomness often dictates short-term results. But successful traders don’t rely on luck. Instead, they build well-researched trading systems that are objective, repeatable, and measurable. In this blog, we explore the concept of trading systems, with a focus on the popular "Pair Trading" strategy, and cover advanced methods including statistical tools and real-world case studies. Let’s get started on the path to structured trading success.
A trading system is a clearly defined set of rules for entering and exiting trades. Unlike emotional or speculative trading, systems are built using logic and data. Think of it as creating a machine that makes decisions based on predefined inputs. Systems help eliminate emotional errors, enforce discipline, and allow backtesting to assess their effectiveness before deploying real capital.
Trading systems are not magic bullets. They require monitoring, tweaking, and strict adherence. But once developed, they can turn trading into a scalable and consistent practice.
Pair trading is a market-neutral strategy involving two correlated stocks. The basic idea is simple: when two historically correlated stocks temporarily diverge in price, we short the outperformer and long the underperformer, expecting the relationship to revert.
Imagine HDFC Bank and ICICI Bank. They operate in similar environments, cater to similar customers, and often move together. If one suddenly shoots up while the other remains flat, a trader might short the one that surged and buy the one that lagged, assuming the gap will close.
This strategy thrives on the concept of mean reversion and is relatively immune to broader market direction.
To identify viable trading pairs, we need tools:
Spread: Difference in daily returns of two stocks
Differential: Difference in absolute stock prices
Ratio: Price of stock A divided by price of stock B
By tracking these metrics over time, we observe patterns and anomalies. For example, a widening spread may indicate a trading opportunity.
Another vital concept is correlation, which measures how closely two stocks move together. A correlation close to +1 indicates strong positive relation, essential for successful pair trading.
Once we have a pair, we analyze its relationship statistically. We use Excel to calculate:
Daily returns
Correlation (based on prices or returns)
Spread, differential, and ratio
We also calculate basic statistics like mean, median, and mode to understand the central tendencies of these variables.
This chapter introduces normal distribution and standard deviation, which help determine how far a stock's behavior is from its average.
We set up a standard deviation table for spread, differential, and ratio. When a value falls 2 or 3 standard deviations away from the mean, it could signal a high-probability trade.
A key refinement is tracking the density curve, which gives the probability of the variable reverting to the mean.
For example:
If the density value is 0.975, the ratio is far from the mean and has a high chance of mean reversion.
This helps traders stay disciplined and avoid false signals. Tools like Excel's NORM.DIST function make it easy to implement.
With all variables aligned, it’s time to trade. General guidelines:
Go long the ratio when density is between 0.003 and 0.025
Go short when density is between 0.975 and 0.997
Monitor the ratio daily, and exit as it reverts toward the mean. Use standard deviation zones as stop-loss and take-profit levels.
These chapters introduce a more statistical approach:
Straight Line Equation using regression
Linear Regression to model expected price
Error Ratio to measure deviation
ADF Test to ensure the relationship is stationary
These methods improve reliability by grounding decisions in mathematics.
Combining the previous methods, we can now identify trades with high confidence. This involves calculating expected behavior, identifying divergence, and acting when the odds favor reversion.
Chapter 13 & 14: Live Trade Examples
Real examples show how these techniques work in the market. Each trade highlights entry, rationale, risk control, and outcome. These are powerful learning tools for traders.
A new strategy that involves buying and selling futures contracts of the same stock with different expiry dates. It benefits from time decay and volatility changes.
Chapter 16: Momentum Portfolios
Here, traders build a portfolio of high-momentum stocks, aiming to ride the trend. Selection is based on performance metrics and relative strength.
Conclusion
Trading systems transform subjective decisions into objective, testable strategies. Pair trading, with its roots in statistics and market logic, offers a fantastic entry point. By combining discipline, data, and sound risk management, traders can consistently capture edge in the market.
Happy Trading!
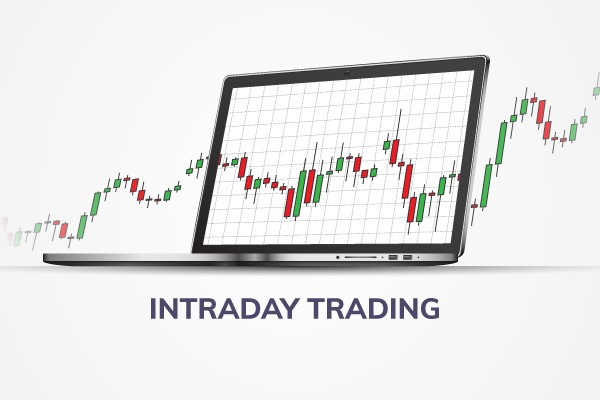
A Beginner's Guide to Intraday Trading: Tips, Strategies, and Essentials
Introduction
Intraday trading, also known as day trading, involves buying and selling stocks within the same trading day to profit from price fluctuations. It’s a fast-paced, high-risk, high-reward approach that appeals to those seeking quick gains. Success requires knowledge, discipline, and a solid strategy. This guide, inspired by insights from AGSSL, breaks down the essentials of intraday trading for beginners, offering practical tips to help you navigate the stock market confidently. Visit AGSSL for tools and resources to get started.
What is Intraday Trading?
Intraday trading refers to purchasing and selling stocks during a single day’s trading hours, typically between 9:15 AM and 3:15 PM in India. The goal is to profit from small price movements by closing all positions before the market shuts, avoiding overnight risks. Unlike long-term investing, intraday trading leverages volatility for immediate returns but demands quick decision-making and risk management.
Key Features of Intraday Trading:
Why Choose Intraday Trading?
Intraday trading offers unique advantages that attract both new and seasoned traders:
However, the high risk of losses and constant market monitoring make it unsuitable for everyone. Beginners must approach intraday trading with caution and preparation.
Getting Started: Steps for Beginners
To embark on your intraday trading journey, follow these foundational steps:
How to Choose Stocks for Intraday Trading
Selecting the right stocks is critical for intraday success. Here are key tips to guide your selection:
Top Intraday Trading Strategies
Effective strategies help beginners maximize returns while managing risks. Here are five proven approaches:
Essential Intraday Trading Tips
To succeed in intraday trading, adopt these best practices:
Common Mistakes to Avoid
Beginners often fall into traps that lead to losses. Here’s what to watch out for:
Tools and Indicators for Intraday Trading
To enhance your trading decisions, use these tools and indicators:
Risk Management in Intraday Trading
Effective risk management is the backbone of successful intraday trading. Follow these principles:
Conclusion
Intraday trading offers exciting opportunities for quick profits but comes with significant risks. By educating yourself, choosing liquid stocks, adopting proven strategies, and practicing strict risk management, you can increase your chances of success. Platforms like AGSSL provide valuable tools, real-time data, and educational resources to support beginners. Start small, practice with a demo account, and stay disciplined to build your skills over time.
Ready to dive into intraday trading? Open a free Demat and trading account with AGSSL to access their user-friendly platform and expert guidance. Visit AGSSL to get started today!
Call to Action

An Initial Public Offering (IPO) is a pivotal moment for a company, marking its transition from private to public by offering shares to the public for the first time. This process allows businesses to raise capital and provides investors an opportunity to own a stake in promising companies. In this blog, we’ll explore what an IPO is, how it works, and key considerations for investors, with insights tailored for the Indian market.
An IPO is the process through which a privately held company becomes publicly traded by issuing shares on a stock exchange. It enables the company to raise funds for growth, debt repayment, or other strategic goals while offering investors a chance to participate in its future success. Once listed, shares are traded in the secondary market, providing liquidity to shareholders.
Companies launch IPOs for several reasons:
Raising Capital: Funds support business expansion, infrastructure upgrades, or debt reduction.
Liquidity for Shareholders: Early investors and founders can sell their stakes, as private shares have limited liquidity.
Enhanced Visibility: Public listing boosts brand credibility, attracting talent and partnerships.
Market Access: Public companies can issue additional shares for mergers, acquisitions, or further growth.
The IPO process in India is regulated by the Securities and Exchange Board of India (SEBI) and involves the following steps:
Preparation: The company works with investment banks, auditors, and legal teams to prepare financial statements and a prospectus detailing operations, risks, and financial health.
Underwriter Selection: An investment bank is hired to underwrite the IPO, setting the share price and facilitating share sales to investors.
Regulatory Approval: The company files a registration statement with SEBI, which reviews it for compliance.
Pricing and Valuation: The share price is determined based on company fundamentals, market demand, and underwriter analysis.
Roadshow and Marketing: The company promotes the IPO to institutional and retail investors through presentations and campaigns.
Share Allotment: Shares are allocated to applicants, often via a lottery system if the IPO is oversubscribed.
Listing: Shares are listed on a stock exchange (e.g., BSE or NSE), and trading begins.
IPOs in India are categorized into two types:
Fixed Price Issue: The share price is set in advance and disclosed in the offer document. Demand is known only after the issue closes, often leading to high oversubscription.
Book Building Issue: A price band (floor and cap prices) is set, and the final price is determined by investor bids, offering flexibility and efficiency.
IPO valuation depends on:
Company Fundamentals: Assets, liabilities, revenue, and growth prospects are analyzed.
Market Conditions: Supply and demand influence pricing.
Underwriter Assessment: Investment banks evaluate the company to set a fair price.
Investors should review the prospectus to assess whether the IPO is underpriced (potential for gains) or overpriced (limited returns post-listing). Valuation ratios like P/E, P/B, and debt-to-equity provide deeper insights.
SEBI mandates IPO grading by a registered Credit Rating Agency (CRA) to evaluate a company’s fundamentals. Grades range from 1 (weak) to 5 (strong) and assess factors like business prospects, management quality, and governance. While a higher grade suggests better potential, investors should still conduct independent research, as grading isn’t a guarantee of success.
Any adult with a PAN card and a valid demat account can apply for an IPO. A trading account is required to sell shares post-listing. Here’s how to apply:
Online Application:
Use Agssl’s app or website.
Enter details like lot size, bidding price, and UPI ID.
Approve the payment mandate via a UPI app.
Offline Application:
Submit a physical form to the IPO banker or broker.
Alternatively, use the ASBA (Application Supported by Blocked Amount) process through a bank.
UPI-Based Application: Funds are blocked in your bank account until allotment, then debited or released based on allocation.
Cut-Off Price: Bidding at the final issue price increases allotment chances, especially for retail investors.
In oversubscribed IPOs, shares are allotted via a lottery system, with retail investors guaranteed at least one lot per SEBI rules. Common reasons for non-allotment include:
Multiple applications with the same PAN.
Mismatched UPI, bank, or demat details.
Bidding below the final issue price.
Check allotment status on the Agssl app or the registrar’s website (e.g., Kfin Technologies). Shares are credited to the demat account, and trading begins on the listing date, typically at 10:00 AM.
Investors can sell shares on the listing day or later, depending on their goals. Key considerations include:
Listing Day Gains: Prices often rise initially due to demand, offering quick profits.
Long-Term Holding: Suitable for companies with strong growth potential.
Tax Implications: Short-term capital gains tax applies if sold within a year.
Lock-Up Periods: Some IPOs restrict selling to prevent share dumping.
Issue Size: ₹24.71 crore (31.28 lakh shares).
Price Band: ₹75–₹79 per share.
Dates: March 28, 2025–April 3, 2025.
Listing: BSE SME, April 8, 2025.
Minimum Investment: ₹1,20,000 (1,600 shares) for retail investors.
Purpose: Develop new courses, enhance LMS features, and purchase equipment.
Dates: July 24, 2024–July 26, 2024.
Listing: July 31, 2024.
Focus: K-12 educational publishing with digital content via QR codes.
Minimum Lot: 1,600 shares.
Research Thoroughly: Study the prospectus for company details, risks, and financials. Check IPO grading and credit ratings (e.g., CRISIL, CARE).
Analyze Fundamentals: Evaluate valuation ratios and growth prospects. Avoid IPOs focused solely on debt repayment.
Maximize Allotment Chances:
Apply for one lot in oversubscribed IPOs.
Bid at the cut-off price.
Use multiple demat accounts (with different PANs) for family members.
Submit applications early to avoid technical issues.
Understand Risks: IPOs lack trading history, making them riskier. Diversify investments and align with your financial goals.
Market Volatility: Post-listing price fluctuations are common.
Oversubscription: Reduces allotment chances for retail investors.
Limited Data: Unlike established stocks, IPOs lack historical trading performance.
Purpose of Funds: IPOs focused on debt repayment or working capital may offer lower growth potential.
IPOs offer a unique opportunity to invest in companies at an early stage, but they come with risks that require careful evaluation. By researching the company’s fundamentals, understanding the application process, and aligning investments with your goals, you can make informed decisions. Platforms like Agssl simplify IPO applications with user-friendly tools and provide resources like IPO calendars and analysis reports.
Ready to explore upcoming IPOs? Visit Agssl’s Upcoming IPOs for the latest opportunities and start your investment journey today!
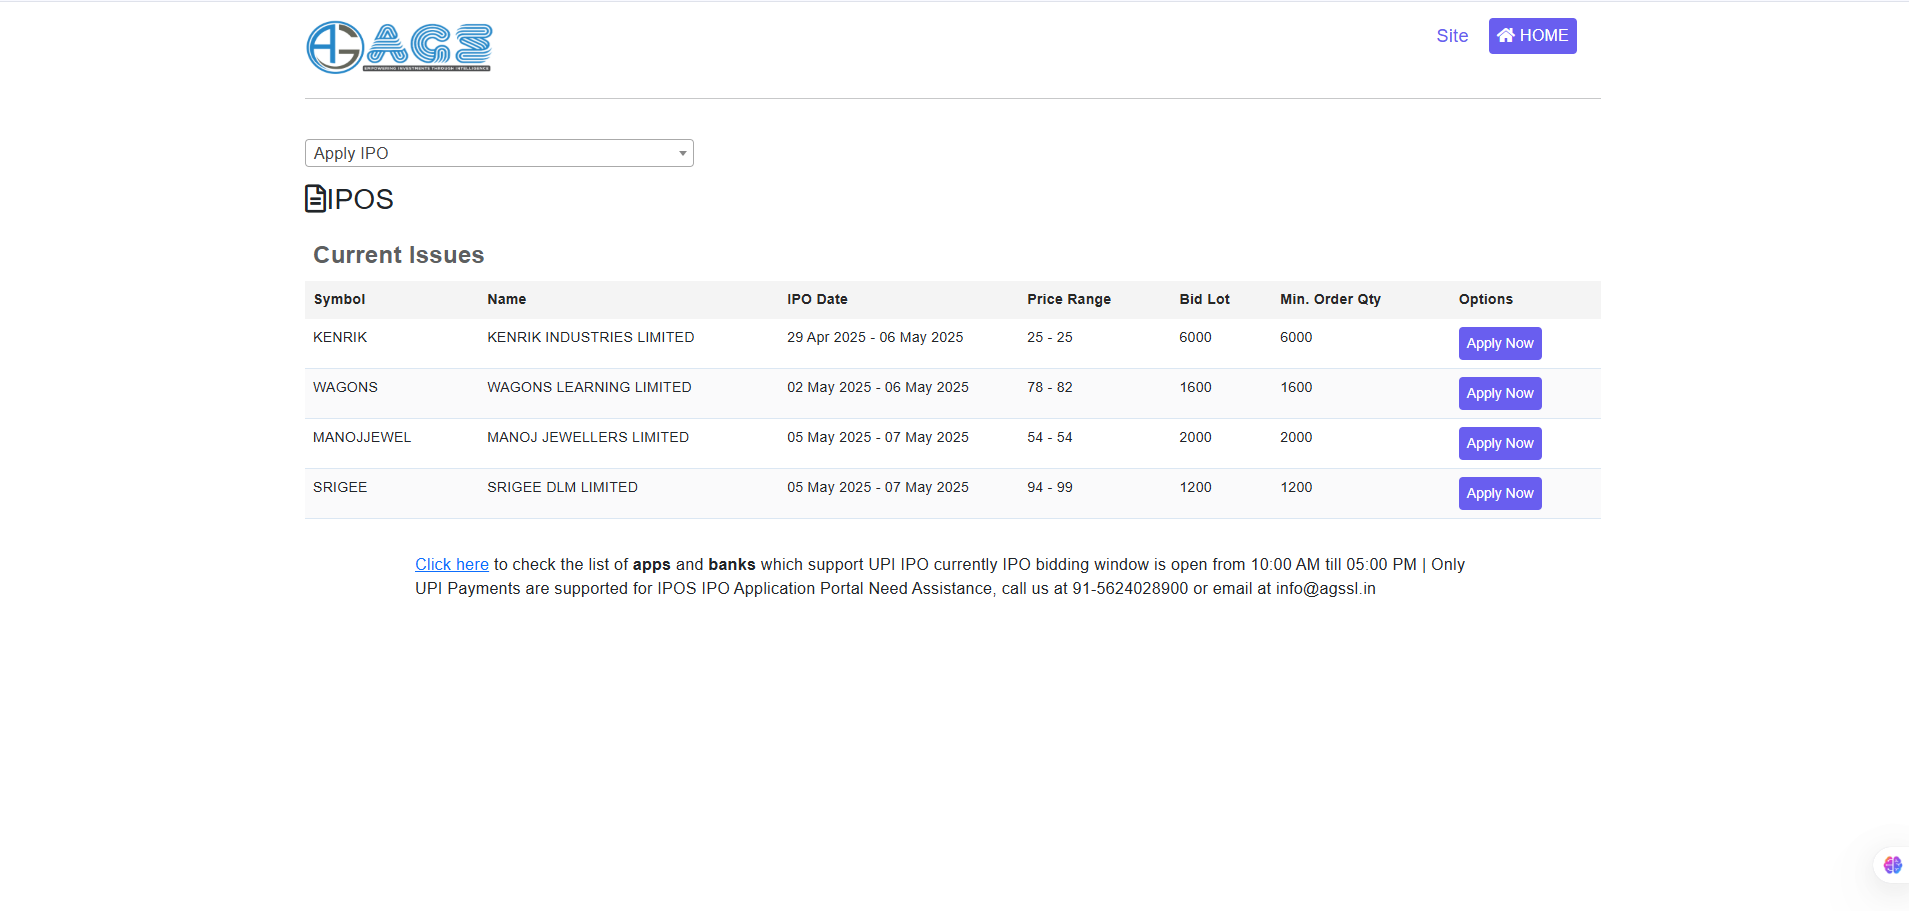
An Initial Public Offering (IPO) is a significant opportunity for investors to participate in a company's growth by purchasing shares before they are listed on the stock exchange. This guide outlines the steps to apply for an IPO, focusing on the online application process, eligibility criteria, and key considerations for a seamless experience.
Applying for an IPO can be done through offline or online methods. The online method is more convenient, as it leverages your existing trading or demat account to streamline the process. Below are the detailed steps to apply for an IPO online, inspired by the process outlined by AG Shares:
Login to Your Agssl Platform
Access the Agssl website. Navigate to the homepage and locate the ‘IPO’ section. Ensure you have an active demat account linked to Agssl.
Select the Desired IPO
Browse the list of active IPOs and select the one you wish to apply for. Review critical details such as the maximum quantity, price range, company background, and subscription period.
Enter Application Details
Click on ‘Apply Now’ or a similar button to start the application. Provide the following details:
Number of Lots: Specify the number of share lots you want to bid for (a lot is a fixed number of shares defined by the IPO).
Bidding Price: For book-built IPOs, enter a price within the indicated price band. For fixed-price IPOs, use the predetermined price.
UPI ID: Link your UPI ID for payment processing under the ASBA (Applications Supported by Blocked Amount) facility.
Confirm and Submit the Application
Review your bid details and submit the application. A payment mandate will be sent to your UPI app. Accept this mandate to block the required funds in your bank account. The funds remain blocked until the allotment is finalized.
Track Application Status
After submission, monitor the status of your IPO application in the ‘Order Book’ or ‘IPO Application Status’ section of the Agssl platform. You’ll be notified about the allotment outcome.
Allotment and Demat Credit
If allotted, the shares are credited to your demat account within 10-12 days for book-built IPOs. The blocked amount in your bank account is debited only for the allotted shares, and any remaining blocked funds are released.
Trading the Shares
Once the IPO is listed on the stock exchange, you can sell the allotted shares using a trading account. If you don’t have a trading account, you’ll need one to trade the shares post-listing.
To apply for an IPO, you must meet the following requirements:
Legal Competency: Be an adult capable of entering a legal contract.
PAN Card: Hold a valid Permanent Account Number (PAN) issued by the Income Tax Department.
Demat Account: Have an active demat account to hold the allotted shares. A trading account is optional for applying but necessary for selling shares post-listing.
Retail investors (investing up to ₹2 lakh) benefit from a higher chance of allotment due to SEBI’s allocation rules favoring retail categories.
Before applying, familiarize yourself with the types of IPOs and related terms:
Types of IPOs:
Fixed Price IPO: The share price is set in advance, and investors apply at that price.
Book Built IPO: A price range is provided, and the final price is determined through a book-building process based on investor bids.
Offer Types:
New Offer: A company raises funds and lists on the stock exchange for the first time.
Follow-on Public Offer (FPO): An already listed company issues additional shares to raise more funds.
Offer-For-Sale (OFS): Existing shareholders, such as promoters, sell their shares without increasing the company’s share capital.
ASBA Facility: SEBI’s ASBA system ensures that funds are blocked in your bank account rather than debited upfront. Only the amount for allotted shares is debited, making the process efficient.
Retail Investor Advantage: Applying under the retail category (up to ₹2 lakh) increases your chances of allotment due to SEBI’s equitable distribution rules.
Due Diligence: Research the company’s financials, business model, and market potential. Evaluate risks and growth prospects before investing.
UPI Integration: Ensure your UPI ID is active and linked to a bank account with sufficient funds to cover the application amount.
Applying online through platforms like Agssl is efficient because:
Your demat account details are auto-populated, reducing manual errors.
The process is faster and can be completed from anywhere.
Real-time tracking of application status is available.
Applying for an IPO is a straightforward process if you have a demat account and access to the Agssl platform. By following the steps outlined above, you can participate in exciting investment opportunities with ease. Always conduct thorough research on the company and its IPO terms to make informed decisions. Start your investment journey today by opening a demat account with Agssl and exploring upcoming IPOs.

Complete Guide to the IPO Process in India: From Private to Public
Introduction: Why Do Companies Go Public?
An Initial Public Offering (IPO) is a major milestone in a company’s growth journey. It marks the transition of a privately held company into a publicly traded one, giving the general public an opportunity to invest in its shares. But the IPO journey is not just about selling shares — it’s about raising capital, building credibility, enhancing liquidity, and gaining access to wider financial markets.
The process of launching an IPO in India is comprehensive, highly regulated by the Securities and Exchange Board of India (SEBI), and must follow a structured, step-by-step path. If you’re a business owner considering an IPO or an investor wanting to understand the process, this guide is for you.
Key Reasons Companies Choose to Go Public
1. Raise Capital for Expansion
The primary motivation for going public is to raise significant capital to fund business growth — whether it’s expanding into new markets, launching new products, acquiring other companies, or simply reducing debt.
2. Increase Brand Credibility and Visibility
IPO listing boosts the public image of a company. It signals transparency and financial maturity, helping to build trust among customers, suppliers, and potential business partners.
3. Liquidity for Existing Investors
Private shares are illiquid and hard to trade. IPOs allow existing shareholders — founders, early investors, and employees — to convert their holdings into tradable shares, unlocking value and enabling exits.
4. Establish Market Value
When a company lists on the stock exchange, the market determines its value through share pricing and trading activity. This market-based valuation can assist in future fundraising, partnerships, and strategic decisions.
5. Access to Broader Financial Instruments
Once listed, a company can explore multiple fundraising routes beyond equity — including debt offerings, convertible securities, and rights issues. This opens up long-term strategic financial flexibility.
The IPO Process in India: A Step-by-Step Overview
Launching an IPO is a complex journey, typically taking 6–9 months, and involving several stakeholders, including legal advisors, auditors, merchant bankers, and market regulators. Here's a step-by-step breakdown:
Step 1: Appoint an Investment Bank or Underwriter
The first move is to hire one or more investment banks or underwriters. Their role is to evaluate the company’s financial health, determine capital requirements, structure the IPO, and assist in regulatory filings. They also take part in pricing the shares and marketing the IPO.
An underwriting agreement is signed that outlines the amount to be raised, types of securities to be issued, and responsibilities of all parties involved.
Step 2: Prepare DRHP and File with SEBI
The company and its advisors prepare a Draft Red Herring Prospectus (DRHP), a detailed legal document that includes:
Financial statements
Industry overview
Business and operational details
Promoter and management info
Risk factors and litigation history
Proposed use of IPO proceeds
The DRHP is submitted to SEBI and the Registrar of Companies (RoC). SEBI reviews it for compliance with the SEBI ICDR Regulations, and if required, returns it with comments for clarification or changes.
Once approved, the company can fix the IPO timeline and proceed to market the issue.
Step 3: Apply to Stock Exchanges
The company must now decide where it wants to list — typically on the NSE or BSE — and file the application accordingly. Exchange approval is mandatory for listing.
Step 4: Conduct Roadshows and Marketing
Next comes the roadshow phase — typically lasting 1 to 2 weeks — where senior management and investment bankers travel across cities, meeting with institutional investors like Qualified Institutional Buyers (QIBs).
This step helps generate buzz, build credibility, and gauge investor interest. The company showcases:
Growth story and future plans
Financial performance
Competitive advantages
Reasons to invest
Roadshows may be physical or virtual, and the feedback collected helps finalize pricing.
Step 5: Pricing the IPO – Fixed vs Book-Building
Companies can choose from two pricing mechanisms:
Fixed Price Issue
The price per share is decided in advance and disclosed in the prospectus. Investors know what they are paying at the time of application.
Book-Building Issue
A price band is provided (e.g., ₹100–₹120). Investors bid for shares within this range, and the final price is determined by demand. This method is preferred as it leads to better price discovery and more transparent allocation.
The final price is called the cut-off price, and shares are allocated accordingly.
Step 6: Offer Opens to the Public
Once pricing is finalized, the IPO opens for subscription — typically for 3 to 5 working days. Applications can be submitted online or offline through ASBA (Application Supported by Blocked Amount) via banks and brokers.
SEBI regulates IPO timing to avoid overlap with large competing offerings and to ensure retail investor protection.
Retail investors, QIBs, and Non-Institutional Investors (NIIs) all participate in different reserved quotas.
Step 7: Share Allotment and Listing on the Exchange
After the subscription window closes:
Applications are verified
Shares are allotted based on demand
Refunds are issued to non-allottees (in oversubscribed cases)
Shares are credited to investor demat accounts
Oversubscription is common. For instance, if the IPO is oversubscribed 5x, investors may receive only 20% of the shares they applied for.
The company then finalizes its listing date. On this day, its shares begin trading on the exchange.
Lock-In Periods and Post-IPO Market Dynamics
SEBI enforces a lock-in period for promoters and select investors, typically ranging from 6 months to 3 years, to prevent immediate stock dumping that could destabilize prices.
When the lock-in ends, short-term fluctuations may occur as shares hit the open market.
Also, IPO stock prices may fluctuate after listing, depending on market sentiment, investor perception, and broader economic trends.
Conclusion: IPO as a Strategic Growth Lever
Launching an IPO is not just a financial decision — it’s a strategic transformation. It requires transparency, operational excellence, and investor confidence. While the rewards are high — capital, credibility, liquidity — the risks are also significant if the process is not managed carefully.
If you're an investor or a business looking to understand the IPO journey, staying informed is key.
For detailed IPO reviews, latest listings, and company analysis, visit Agssl’s IPO review section.
Frequently Asked Questions (FAQs)
Q1. What is the difference between DRHP and RHP?
DRHP (Draft Red Herring Prospectus) is the initial filing with SEBI, while RHP (Red Herring Prospectus) is the final version issued before the IPO opens to the public.
Q2. Who can invest in an IPO?
Retail investors, QIBs (like mutual funds and banks), and Non-Institutional Investors (HNIs) can all apply for IPO shares.
Q3. What is oversubscription in IPOs?
It means more demand than available shares. In such cases, allotment is made proportionately or by lottery (in retail category).
Q4. How long does it take to go public in India?
Typically, 6–9 months, but it can vary depending on regulatory approvals and market readiness.
Understanding Intraday Trading: Strategies, Tips, and Benefits – by AGSSL
For those looking to actively participate in the stock market and capitalize on short-term price movements, intraday trading offers a compelling opportunity. Unlike traditional investing where you hold stocks for months or years, intraday trading focuses on buying and selling stocks within the same trading day. This means all positions are squared off before the market closes. In this blog, AGSSL breaks down everything you need to know about intraday trading — from its definition and key strategies to the tools and indicators that can help you succeed.
What is Intraday Trading?
Intraday trading, often referred to as day trading, is the process of purchasing and selling financial instruments (like stocks) within a single trading day. The primary objective isn't long-term wealth creation but to generate quick profits from the small fluctuations in stock prices that occur throughout the day.
When placing intraday trades, it is important to specify that your order is for intraday purposes. This tells your broker that you intend to close the position on the same day, avoiding the risk and exposure of holding stocks overnight.
Why Intraday Trading?
The appeal of intraday trading lies in its fast-paced nature and potential for rapid returns. Unlike long-term investing, which requires patience, intraday trading is dynamic and can yield results within hours or even minutes. However, with greater reward comes greater risk. That’s why AGSSL encourages traders — especially beginners — to approach intraday trading with caution and preparation.
AGSSL’s Essential Intraday Trading Tips for Beginners
For those new to the market, intraday trading can be daunting. But by following a few key principles, you can build a strong foundation:
1. Start with Small Capital
Begin with an amount you’re comfortable risking. This will allow you to gain experience without taking on undue financial pressure.
2. Use Stop-Loss Orders
A stop-loss order automatically sells your stock when it reaches a specific price, helping you limit potential losses. This is an essential risk management tool in intraday trading.
3. Don’t Chase the Market
Avoid making impulsive trades based on sudden market movements or news. Stay focused on your strategy.
4. Stay Updated with Market News
Always keep track of news that may affect the markets — such as company earnings, economic reports, or global events.
5. Stick to a Trading Plan
Develop a clear plan including entry and exit strategies and stick to it. Discipline is key in trading.
Key Intraday Trading Indicators to Know
Successful intraday trading relies heavily on technical analysis. Traders often use indicators — tools that analyse past and current price trends — to make informed decisions. Here are the most effective ones used by professionals:
Moving Averages (MA)
Helps identify the direction of the market trend by averaging out price data over a specific period.
Bollinger Bands
Shows market volatility and potential overbought or oversold conditions.
Relative Strength Index (RSI)
Measures the strength and speed of a stock’s price movement. An RSI above 70 may indicate overbought conditions, while below 30 may signal oversold.
Stochastic Oscillator
Compares a security’s closing price to its price range over a given time period. It’s useful for spotting trend reversals.
How to Maximize Profits in Intraday Trading
While profit-making is the goal, intraday trading is inherently volatile. Here are some AGSSL recommendations to help you trade more effectively and reduce risk:
Limit Your Risk
Never risk more than 2% of your total capital on a single trade. This keeps your losses manageable.
Choose High-Liquidity Stocks
Stick to stocks with high volumes. This makes it easier to enter and exit trades quickly without affecting the price.
Mind the Clock
The best time for intraday trading is typically between 11:00 AM and 1:00 PM, when the market stabilizes after the morning rush.
Set Realistic Targets
Define your profit goals and exit the trade when those targets are achieved. Greed often leads to missed opportunities.
Final Thoughts from AGSSL
Intraday trading isn’t for everyone, but for those willing to learn, it can be both exciting and rewarding. It requires discipline, a strong grasp of market indicators, and continuous learning. At AGSSL, we believe that with the right tools and mindset, anyone can improve their intraday trading skills and take advantage of market movements — one day at a time.
If you're interested in learning more about trading strategies or want to open an intraday trading account, AGSSL is here to help you every step of the way.
How to Pick the Best Stocks for Intraday Trading: A Complete Guide
Intraday trading, also known as day trading, is a popular method of market speculation where
traders buy and sell stocks within the same trading day. The goal is simple: take advantage of small
price movements to earn quick profits. But there's one golden rule that can make or break your
intraday trading success - stock selection.
Let's break down the key strategies and insights that will help you pick the best stocks for intraday
trading.
What is Intraday Trading?
In intraday trading, positions are opened and closed within the same day. For instance, if you buy
500 shares of Reliance at Rs.920 in the morning and sell them at Rs.928 by evening, you make a
profit of Rs.4,000 (500 x Rs.8). You can also short sell, i.e., sell first and buy later, to profit from
falling prices - a practice only possible through intraday trading.
Why Stock Selection Matters in Intraday Trading
Many traders fail to make profits because they pick the wrong stocks. Success depends on choosing
liquid, predictable, and volatile (but not overly erratic) stocks that respond to market trends and
news. Here are the key factors you must consider:
1. Trade Only in Liquid Stocks
Liquidity refers to how easily a stock can be bought or sold without impacting its price.
- Highly liquid stocks have large trading volumes, allowing traders to enter and exit positions with
ease.
- Illiquid stocks often lack enough buyers or sellers, making it hard to complete trades or causing
large price changes for even small orders.
Tip: Look for stocks that trade at least 50,000 to 75,000 shares per day if the price is between Rs.50
to Rs.100. For higher value stocks, you'll need even more volume.
Also, check liquidity at various price levels. A stock may be liquid at Rs.100 but illiquid at Rs.120.
Monitor such behavior to make smarter entries and exits.
2. Avoid Highly Volatile Stocks
Stocks with low volume or those affected by sudden news events can behave unpredictably. While
some volatility is essential for profit opportunities, too much can spell disaster.
- Most intraday traders look for stocks that move 3-5% in a day - not more.
- Avoid penny stocks and low-cap segments (like S, T, and Z groups), which often have both low
volume and high unpredictability.
3. Trade in Stocks with Good Correlation to Indices
Stocks that move in sync with their sector or index offer more predictability.
For example:
- A strengthening rupee might hurt IT stocks due to lower export earnings.
- Similarly, a surge in oil prices may impact aviation stocks.
Choose stocks that reflect the sentiment of their sector or the broader market for more reliable
trends.
4. Follow the Trend
Always trade with the trend, not against it.
- In a bull market, pick rising stocks.
- In a bear market, look for stocks that are declining and consider short selling.
Trend-based trading reduces risk and improves your chances of success.
5. Do Your Research
Good research is the backbone of profitable trading.
Here's a step-by-step strategy:
1. Identify the market trend - bullish or bearish.
2. Choose sectors showing strength or weakness.
3. Pick stocks within those sectors that show good volume and liquidity.
4. Use technical analysis - study support, resistance, and price action.
5. Check fundamentals and news triggers for extra insights.
Don't just follow tips or social media. Build your watchlist through data-backed analysis.
6. Check the Following Technical Criteria
a. Liquidity Ratio
- Use this formula: Liquidity = Average Daily Volume / Market Capitalization
- Look for a minimum 10% liquidity ratio to ensure smooth trade execution.
b. Impact Cost
- Impact cost is the price effect of placing a large buy or sell order.
- Low impact cost = better entry/exit prices.
c. Widely Owned Stocks
- Stocks with broad ownership are less prone to manipulation.
- Avoid stocks cornered by a few big players - they can hit circuit limits fast.
d. Narrow Tick Spread
- A smaller gap between buy and sell prices (ticks) means better pricing.
- In intraday trades, wide spreads can eat into profits quickly.
e. Clear Chart Patterns
- Look for stocks with visible trends or repeating patterns.
- Avoid stocks with inconsistent or unclear chart histories.
f. Sensitivity to News
- Good intraday stocks react quickly to earnings reports, economic indicators, or global events.
- This lets you capitalize on buy-on-rumor, sell-on-news strategies.
How to Pick Stocks Daily?
Here are some daily habits and filters to help you pick the right stocks:
- High Volume Stocks - Focus on shares with significant daily trading activity.
- News-Driven Stocks - Stocks with expected announcements or news events.
- Weekly Trends - Watch stocks showing consistent movement over the past 5 days.
- Breakout Stocks - Those breaching resistance levels with strong momentum.
- Stick to a Few Favorites - Master 5-10 stocks by tracking them daily.
- Watch Top Gainers/Losers - Use these lists to identify momentum trades.
Conclusion
Intraday trading is not just about speed - it's about strategy, discipline, and stock selection. The best
traders focus on:
- Liquidity
- Trend alignment
- Clear patterns
- News sensitivity
Over time, you'll train your eye to spot the right opportunities. Rely on technical analysis, ignore
emotional biases, and stick to data-driven decisions. With practice, your ability to pick the best
intraday stocks will become your greatest edge in the market.
AGSSL Tip: Use advanced trading platforms like AGSSL's Online Terminal to monitor stocks in
real-time, execute faster trades, and stay ahead of market moves - all from your browser.
Disclaimer: Intraday trading involves risk. Please consult with a financial advisor before investing.
.png)
How to Do NIFTY Intraday Option Trading?
Written by: Agssl
________________________________________
What is Intraday Trading?
Intraday trading refers to the buying and selling of stocks or derivatives (like options) within the same trading day. All positions must be squared off before market close.
Key Characteristics:
• Short-term strategy aiming for quick profits.
• No overnight risk since positions are closed same day.
• Higher leverage, but higher risk.
• Needs close monitoring of price movements.
________________________________________
What are Options?
Options are financial derivatives that give you the right, but not the obligation, to buy or sell an underlying asset at a predetermined price before or at expiration.
Two Types of Options:
1. Call Option – Right to buy.
2. Put Option – Right to sell.
In intraday trading, NIFTY options are frequently used because of:
• High liquidity.
• Predictable price movements due to broader market indicators.
________________________________________
What is NIFTY?
NIFTY (National Fifty) is a stock market index consisting of 50 of the largest and most liquid stocks listed on the National Stock Exchange (NSE).
NIFTY Highlights:
• Reflects the overall market sentiment.
• Includes companies from 13 different sectors.
• Widely used for benchmarking mutual funds and ETFs.
Popular variants include:
• NIFTY 50 – The main index.
• BANK NIFTY – Represents 12 major Indian banks.
• FIN NIFTY, IT NIFTY, etc. – Represent specific sectors.
________________________________________
How to Trade NIFTY Options Intraday?
Intraday trading in NIFTY options involves taking short-term positions based on market trends, technical analysis, and momentum indicators.
Step-by-Step Guide:
Step 1: Choose a Reliable Broker
Use a brokerage platform that offers:
• Real-time charts
• Option chain analysis
• Low brokerage for intraday trades
Step 2: Use Technical Indicators
Common indicators include:
• Moving Averages (SMA/EMA)
• MACD
• RSI (Relative Strength Index)
• Bollinger Bands
• Volume Analysis
Step 3: Watch the Option Chain
Analyze:
• Open Interest (OI)
• Change in OI
• Implied Volatility (IV)
• Strike price selection based on trend direction.
Step 4: Time Your Entry and Exit
• Ideal trading hours: 9:30 AM to 11:30 AM and 1:30 PM to 3:00 PM
• Always use stop-loss to protect capital.
• Set target prices based on risk-reward ratios.
Step 5: Monitor Market Sentiment
Track:
• Global indices (NASDAQ, FTSE)
• FIIs and DIIs trading activity
• News updates & RBI policy
________________________________________
Tips for Successful Intraday Option Trading
1. Start with ATM or slightly OTM options for better liquidity.
2. Avoid trading in volatile news hours.
3. Use strict stop-loss and take-profit limits.
4. Don’t overtrade — pick 1–2 high-conviction trades per day.
5. Maintain a trading journal — review what works and what doesn’t.
________________________________________
Example: A Basic NIFTY Option Trade
• NIFTY is at 22,500.
• You expect a bullish breakout.
• You buy a 22,600 CE at Rs.120.
• Set a stop-loss at Rs.90 and target at Rs.180.
If NIFTY rises, the premium might shoot up to Rs.180+, giving you a 50%+ return intraday.
________________________________________
How to Invest in NIFTY (Long-Term Options)
For investors looking beyond intraday trading, NIFTY exposure is available through:
1. Index Funds
• Mutual funds that replicate the NIFTY 50 index.
• Passive, low-cost investing.
2. Exchange-Traded Funds (ETFs)
• Trade like stocks.
• Direct exposure to NIFTY’s performance.
3. Futures & Options
• For advanced traders.
• Ideal for short-term speculation and hedging.
________________________________________
Summary
Topic Key Point
Intraday Trading Buy & sell within the same day.
NIFTY Options Right to buy/sell index at fixed strike price before expiry.
Technical Tools RSI, MACD, Bollinger Bands, Volume, Option Chain.
Trading Hours Avoid first 15 mins & last 15 mins unless highly experienced.
Strategy Entry, Stop-Loss, Target, Risk-Reward, and Sentiment Analysis.
Best Practice Start small, follow discipline, journal trades, and focus on learning.
________________________________________
Final Thoughts by Agssl
NIFTY intraday option trading offers a powerful way to leverage market moves, but it’s not for the faint of heart. It requires a combination of analysis, discipline, and experience. Start with paper trading or small capital and focus on building consistency, not chasing profits.
Remember: Capital protection is more important than profit maximization.
Happy Trading!
— Agssl

Understanding High Net Worth Individuals (HNIs): A Comprehensive Guide by Agssl
Introduction
In the realm of wealth management and investment, the term High Net Worth Individual (HNI) holds significant importance. HNIs represent a unique segment of investors who possess substantial financial resources, enabling them to access exclusive investment opportunities and personalized financial services. This blog post, brought to you by Agssl, explores the definition of HNIs, their characteristics, investment strategies, and how Agssl supports this elite group in achieving their financial goals.
Who is a High Net Worth Individual (HNI)?
A High Net Worth Individual (HNI) is typically defined as an individual or family with liquid assets above a certain threshold. In India, the Securities and Exchange Board of India (SEBI) categorizes HNIs as investors who invest a minimum of ₹2 crore in financial instruments or hold a net worth exceeding ₹25 crore, with at least ₹10 crore in financial assets. Globally, the threshold may vary, often starting at $1 million in liquid assets, excluding primary residences.
HNIs are distinguished not only by their wealth but also by their sophisticated approach to investments. They often seek diversified portfolios, exclusive opportunities, and tailored financial advice to preserve and grow their wealth.
Characteristics of HNIs
HNIs exhibit distinct traits that set them apart from retail investors:
Investment Strategies for HNIs
HNIs adopt a range of strategies to manage and grow their wealth. Here are some key approaches:
How Agssl Supports HNIs
At Agssl, we understand the unique needs of HNIs and offer a suite of services designed to cater to their financial aspirations:
Why HNIs Choose Agssl
HNIs trust Agssl for several reasons:
Challenges Faced by HNIs
Despite their financial prowess, HNIs face unique challenges:
Conclusion
High Net Worth Individuals represent a dynamic and influential segment of the investment landscape. With their substantial wealth and sophisticated financial needs, HNIs require personalized strategies and exclusive opportunities to achieve their goals. At Agssl, we are committed to empowering HNIs with cutting-edge tools, expert advice, and a seamless investment experience. Whether you’re looking to diversify your portfolio, explore global markets, or plan for the future, Agssl is your trusted partner in wealth creation and preservation.
Ready to take your investments to the next level? Open an account with Agssl today or download the Agssl Super App to start your journey as an HNI. For more details, visit Agssl’s website or contact our wealth management team.
Disclaimer: Investments are subject to market risks. Please read all scheme-related documents carefully before investing. This blog is for informational purposes only and does not constitute financial advice.
Understanding Return on Equity (ROE): A Comprehensive Guide by AGSSL
Return on Equity (ROE) is a fundamental financial metric that evaluates a company’s profitability by measuring how much return is generated from shareholders’ investment. It indicates how efficiently a company is using the shareholders’ money to generate profits.
What is ROE?
ROE is calculated by dividing a company’s net profit by its net worth (also known as shareholders’ equity):
ROE = Net Income / Shareholders’ Equity
A high ROE indicates effective use of shareholder capital, while a low ROE suggests that the company is not efficiently utilizing its capital.
Generally, a company with ROE above 20% is considered a good investment.
Why Is ROE Important?
ROE is one of the key indicators used to assess a company’s financial health and profitability. Here’s why it's crucial:
Note: ROE should not be the sole parameter for investment decisions. It can be influenced by financial strategies like debt financing, which may artificially inflate the ROE.
How to Calculate ROE?
To calculate ROE:
ROE = Net Income / Shareholders’ Equity
Analysts often use trailing twelve months (TTM) income for a more accurate calculation. In some cases, free cash flow may be used instead of net income, although net income is more widely accepted.
Why Studying ROE is Significant
1. Represents Financial Soundness
A higher ROE often reflects better financial health and efficient management.
2. Analyzes Company’s Financial Growth
By comparing ROE over different time periods, investors can evaluate how consistently a company has grown.
3. Helps in Peer Comparison
ROE is effective in comparing companies within the same industry. Every sector has a benchmark ROE—comparing a company’s ROE with its industry average helps judge its competitive standing.
4. Gauges Company’s Growth
ROE trends reveal how well a company has used retained earnings to grow profits and shareholder value over time.
5. Detects Financial Irregularities
Drastic changes in ROE, especially spikes after periods of loss, may indicate inconsistencies or one-off events impacting earnings.
What High ROE Tells You
How to Use ROE
1. Estimate Sustainable Growth
Use ROE alongside the retention ratio to estimate a company’s future growth and dividend potential.
2. Evaluate Dividend Capability
High ROE suggests a company can afford consistent and potentially increasing dividend payouts.
3. Apply the DuPont Formula
The DuPont formula breaks ROE into three components:
ROE = (Net Profit Margin) × (Asset Turnover) × (Equity Multiplier)
= (Net Income / Sales) × (Sales / Assets) × (Assets / Equity)
This helps investors understand why ROE is high or low—whether it's due to profit margin, efficient asset use, or leverage.
Can ROE Be Negative?
Yes, ROE can be negative when:
Negative ROE isn’t always a red flag—it could reflect short-term investments or development phases. However, it requires cautious analysis as it might also indicate poor financial management or high debt burden.
Key Takeaways
Final Thoughts from AGSSL
At AGSSL, we encourage investors to make informed decisions by using robust financial tools like ROE—but never in isolation. Combine data with industry trends, company fundamentals, and risk assessments for the best results.
Understanding ROE is a step toward identifying financially sound companies with long-term wealth-generating potential.
Let me know if you'd like this formatted for your website (HTML/Markdown) or want to include charts, case studies, or sector-specific examples.
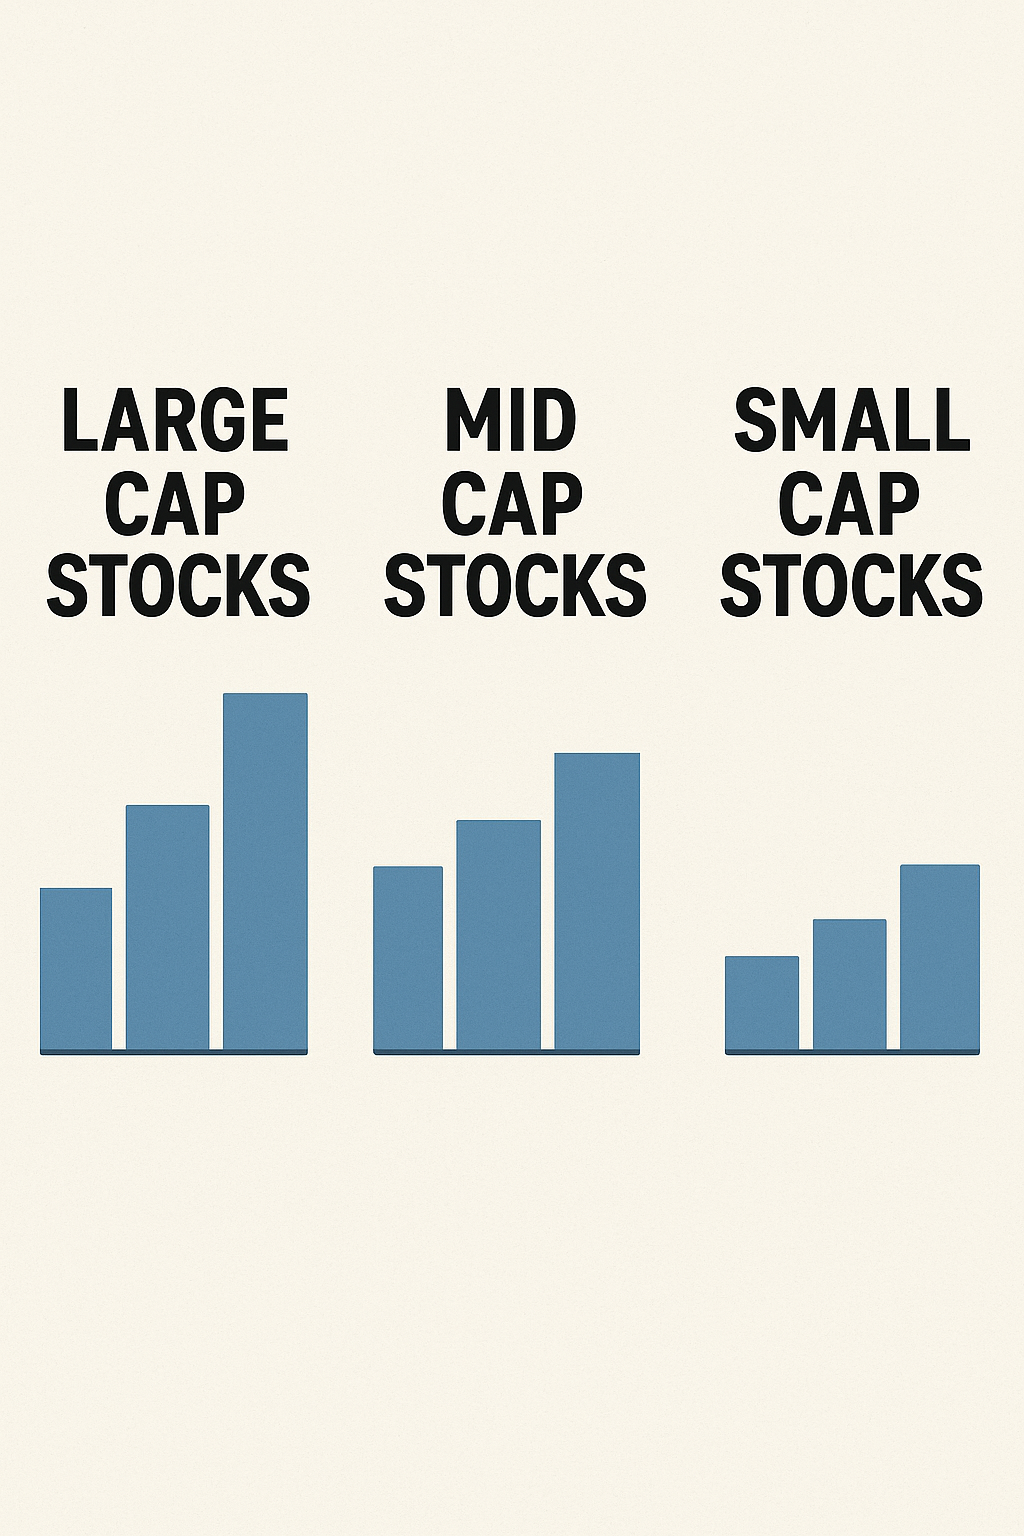
Understanding Large Cap, Mid Cap, and Small Cap Stocks: A Deep Dive by AGSSL
Investing in the stock market requires more than just a hunch or a hot tip. Whether you're a seasoned investor or a beginner, one of the foundational principles you must understand is market capitalisation, or market cap. It helps investors categorize companies based on their size, stability, and growth potential. In this comprehensive guide from AGSSL, we'll explore the key differences between large-cap, mid-cap, and small-cap stocks — and help you decide which combination best suits your investment journey.
Table of Contents
1. What is Market Capitalisation?
Market Capitalisation represents the total value of a company as determined by the stock market. It reflects what the public perceives a company to be worth. This figure provides insight into a company's size, performance expectations, and investment characteristics.
2. How Is Market Capitalisation Calculated?
The formula is straightforward:
Market Cap = Current Share Price × Total Number of Outstanding Shares
For example, if AGSSL Corp. has 100 crore shares trading at ₹200 each, the market cap is:
₹200 × 100 crore = ₹20,000 crore
This number becomes the benchmark for classification.
3. Categories of Stocks by Market Capitalisation
Based on market capitalisation, Indian listed companies are divided into three broad categories.
Large Cap Stocks
Mid Cap Stocks
Small Cap Stocks
4. In-Depth Comparison: Large vs. Mid vs. Small Cap
|
Feature |
Large Cap |
Mid Cap |
Small Cap |
|
Market Presence |
High, often global |
Growing regional/national |
Niche, often emerging |
|
Volatility |
Low |
Moderate |
High |
|
Liquidity |
High |
Moderate |
Low |
|
Risk Level |
Low |
Moderate |
High |
|
Growth Potential |
Limited but steady |
Balanced |
High |
|
Dividend Payout |
Regular |
Variable |
Rare |
|
Investor Suitability |
Conservative |
Balanced risk-takers |
Aggressive growth-seekers |
5. Investor Profiles for Each Market Cap
Large Cap Investors
Mid Cap Investors
Small Cap Investors
6. Risk vs. Reward: What Should You Expect?
Risk and reward are directly proportional to the market cap size.
7. Role of Market Cap in Portfolio Diversification
Diversification is key to successful investing. Spreading your investments across various market cap categories can help reduce overall risk.
Example Portfolio:
This mix ensures that your portfolio weathers economic changes while capturing growth.
8. Market Capitalisation and Mutual Funds
Mutual fund schemes often align their investment strategy with market cap:
Choosing the right mutual fund depends on your investment horizon, goals, and risk appetite.
9. How to Choose the Right Cap Category
Before investing, answer these:
10. Final Thoughts from AGSSL
Market capitalisation is more than just a label — it’s a core principle that helps investors plan intelligently. Whether you're building a retirement corpus, saving for your child’s education, or seeking high returns, knowing the differences between large, mid, and small cap stocks is critical.
At AGSSL, we encourage investors to:
Key Takeaways
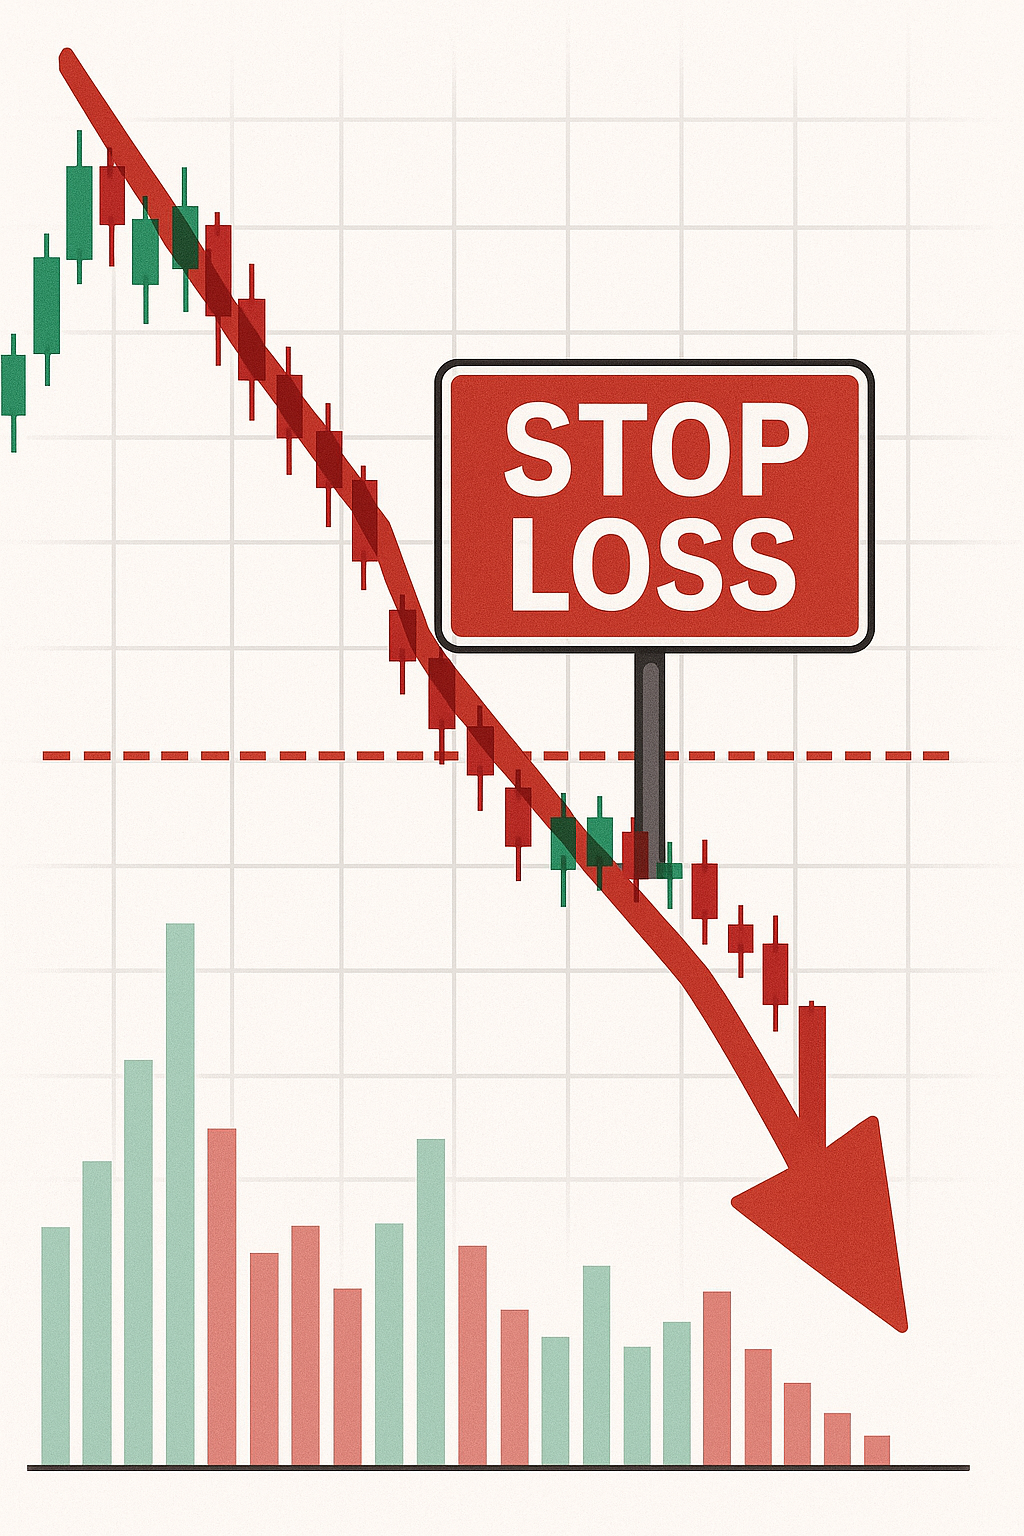
A stop-loss is a trading tool designed to limit potential losses by automatically selling a security when it reaches a preset price. It plays a vital role in helping traders manage risk and maintain trading discipline. In this blog post, we explore the concept of stop-loss, how to set it, its pros and cons, and its importance in investment strategies.
Meet Vinod, a beginner in the stock market who is trying to understand the concept of stop-loss. His friend Ashish, an experienced trader with AGSSL, explains:
A stop-loss is a predefined order to sell a security once it reaches a certain price, limiting the investor’s losses. For instance, Ashish buys 50 shares of ABC Mobiles at ₹1,000 per share. If the price falls to ₹960, he might decide to limit his losses and place a stop-loss order at ₹950. If the stock hits that price, AGSSL will automatically sell his shares, helping him avoid further losses.
On the flip side, if the stock rises to ₹1,400, Ashish might set a trailing stop-loss at ₹1,300 to protect his gains. This strategy allows him to lock in profits while reducing the risk of losing them if the price drops unexpectedly.
Before placing a stop-loss order, consider the following factors:
Determine how much of your capital you are willing to risk on a trade. This percentage helps in deciding an appropriate stop-loss level.
Low-volume stocks can be harder to exit even with a stop-loss in place due to the absence of buyers at the set price.
Larger trades in illiquid stocks can be risky. Ensure the position size matches the stock’s average traded volume.
Highly volatile stocks require a wider stop-loss to avoid premature exits. For less volatile stocks, tighter stop-loss limits can be effective.
Use support and resistance levels, moving averages, and trendlines to set stop-loss orders. A common method is placing the stop-loss just below a support level.
ATR measures market volatility. Many traders use a multiple of ATR to set stop-loss distances, ensuring they account for typical price swings.
If the market is volatile or big news is expected, consider setting wider stop-losses to avoid being exited prematurely.
Test your stop-loss strategy using historical data. Backtesting helps in refining your approach before applying it in live markets.
Pro Tip: Once you set a stop-loss, stick to it. Avoid making emotional decisions during market movements.
Minimizes Losses: Helps preserve capital by capping losses on bad trades.
Improves Risk Management: Encourages disciplined trading and protects long-term investment goals.
Eliminates Emotional Decisions: Prevents panic-based decisions by automating exits.
Triggered by Volatility: Market noise can activate stop-losses, causing premature exits.
Slippage: Orders may execute at a worse price than intended, especially in fast-moving markets.
Price Gapping: Sudden price jumps during market events can skip the stop-loss level entirely.
Psychological Impact: Constantly adjusting stop-loss orders can create anxiety and second-guessing.
Stop-loss orders are an essential part of any investor's toolkit. They provide a safety net during volatile market conditions and offer peace of mind by automating the selling process at predetermined levels. For long-term investors and traders alike, stop-losses foster discipline and prevent catastrophic losses that could derail financial plans.
By reducing the emotional component of trading, they enable investors to focus on strategic decisions rather than reacting impulsively to market swings.
Despite their utility, stop-loss orders are not foolproof:
They don’t account for fundamentals or news events—only price.
Execution may be difficult in low-liquidity or highly volatile markets.
In rare situations, such as flash crashes, stop-losses may not offer complete protection.
To use stop-losses effectively, they should be combined with broader market analysis and a clear trading strategy.
A stop-loss is an essential risk management tool that helps traders and investors minimize potential losses while protecting gains. Whether you are a novice like Vinod or an experienced investor like Ashish, understanding how and when to use stop-loss orders can lead to more disciplined, confident, and successful investing.
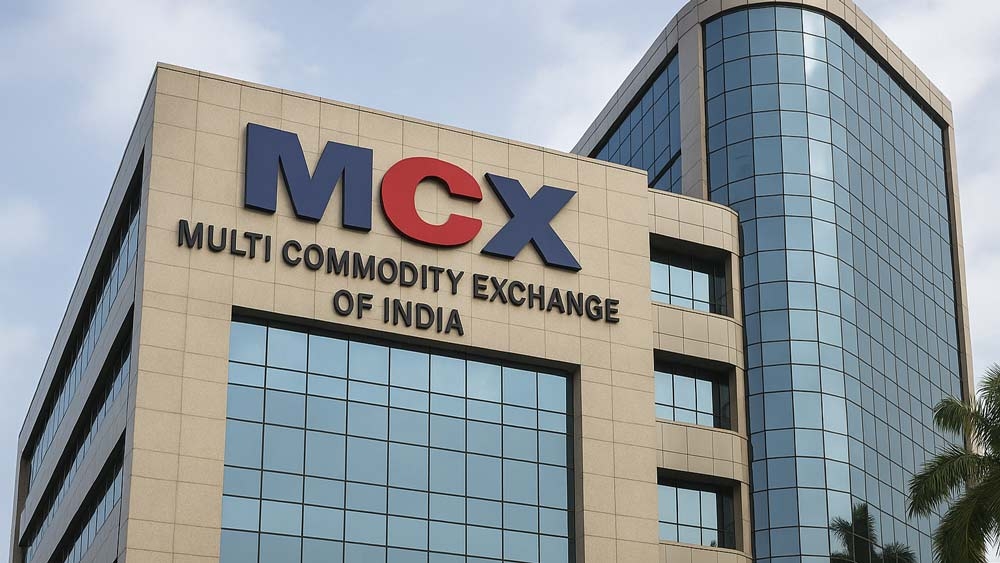
What is MCX?
MCX, or Multi Commodity Exchange of India Ltd, is a commodity derivatives exchange headquartered in Mumbai,
launched in November 2003. Initially overseen by the Forward Markets Commission (FMC), in 2016 it came under SEBI
(Securities and Exchange Board of India). MCX acts as a digital trading platform for a wide range of commodity futures,
allowing investors to hedge, speculate, or diversify their portfolios with real-time price discovery and standardised
contracts.
Commodities Traded on MCX
MCX captures over 60% of India's commodity futures market. It offers a variety of trading options across sectors:
- Agricultural Commodities: Cotton, Soybean & Soybean Oil, Castor Seeds, Mentha Oil
- Metals: Gold, Silver, Copper, Aluminum, Lead, Nickel, Zinc
- Energy: Crude Oil, Natural Gas
- Other Soft Commodities: Coffee, Sugar
What Drives Commodity Prices on MCX?
1. Supply & Demand Dynamics: Basic economics! Any mismatch causes prices to fluctuate sharply.
2. Geopolitical Situations: War, political instability, embargoes, and trade sanctions directly affect commodities.
3. Production Costs: Higher input or labor costs = higher commodity prices.
4. Technological Innovations: Efficiency in production leads to better output and cost control.
Features of MCX Trading
1. Portfolio Diversification: Commodities don't always follow stock market trends.
2. Hedging Opportunities: Protect against price volatility - crucial for sectors dependent on raw materials.
3. Inflation Protection: Commodities like gold retain value during inflationary periods.
4. Liquidity & Accessibility: Easy entry and exit with futures contracts, without physical delivery.
Why Trade on MCX?
- Transparency: Real-time pricing and order books provide fair access
- Flexibility: Multiple contract durations available
What is MCX? A Complete Guide to Commodity Trading in India
- Risk Management: Hedging tools reduce exposure
- Wide Reach: Trade via brokers across India
How to Start Trading on MCX - Step-by-Step
1. Choose a SEBI-registered broker (e.g., Angel One)
2. Open a Commodity Trading & Demat Account
3. Complete KYC: Aadhaar, PAN, Photo
4. Fund Your Account
5. Start Trading: Select your commodity, set price and quantity
External Factors Influencing Commodity Markets
- Weather Conditions: Droughts or floods affect agricultural outputs
- Economic Trends: Demand in manufacturing boosts metal prices
- Government Policies: Subsidies, tariffs, MSPs influence market dynamics
Conclusion
Whether you're an investor, trader, or business managing input costs, MCX offers an efficient, regulated platform.
Explore commodity trading through a trusted broker like Angel One and diversify your investment journey.
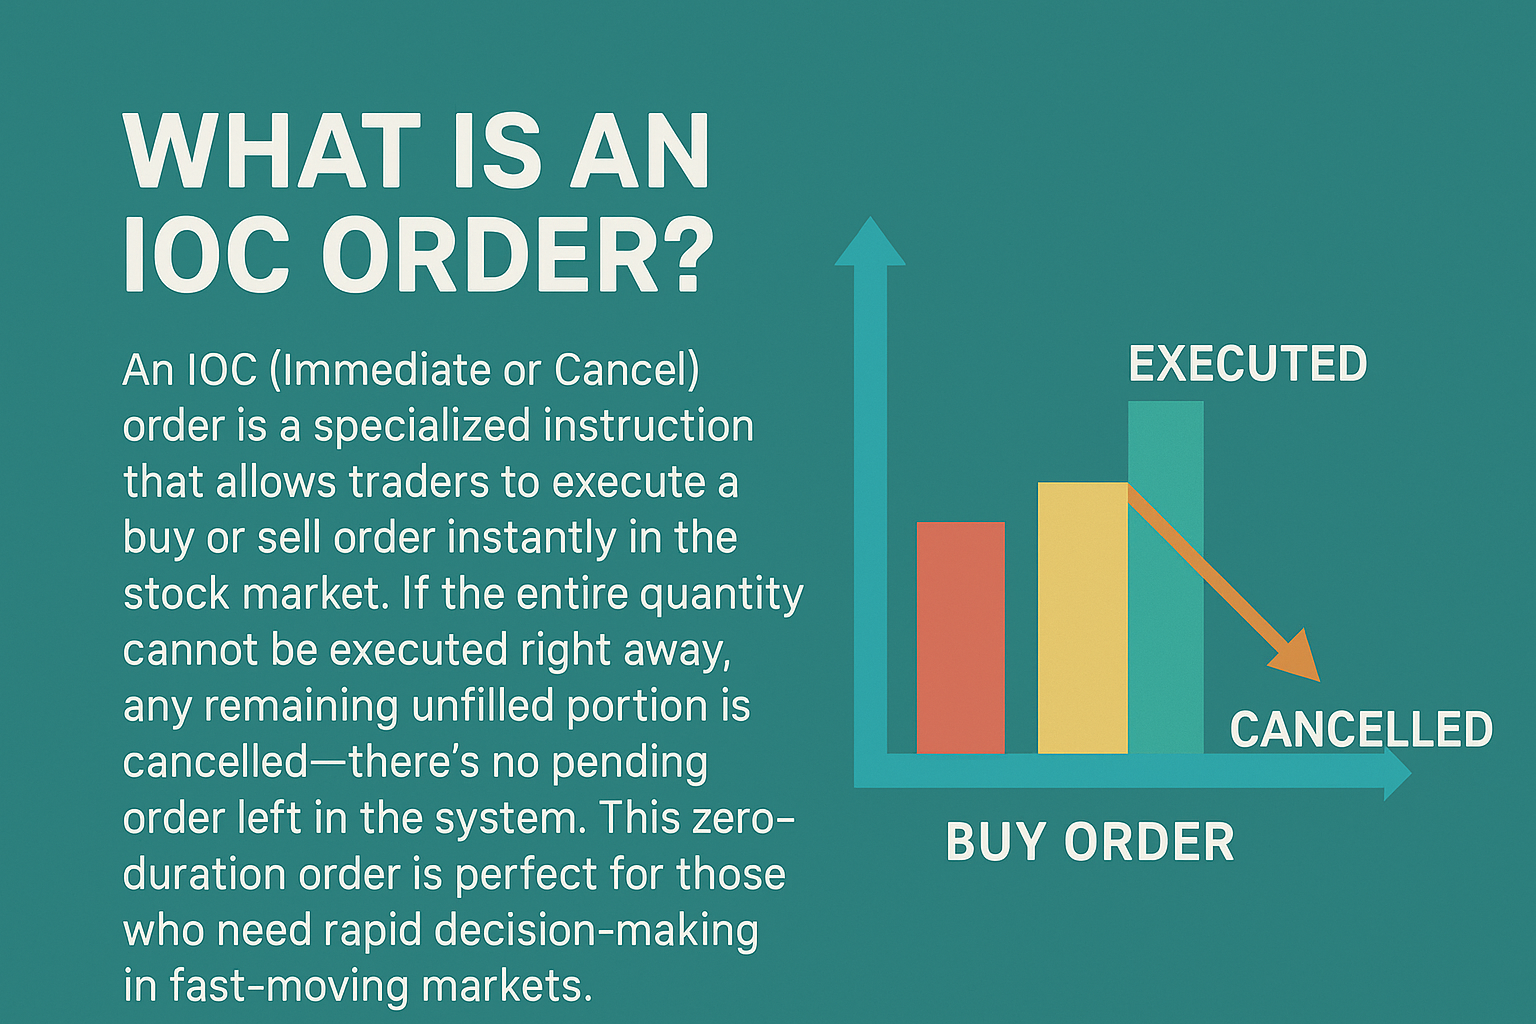
Immediate or Cancel (IOC) Orders: Comprehensive Overview | Agssl
What is an IOC Order?
An IOC (Immediate or Cancel) order is a specialized instruction that allows traders to execute a buy or sell order instantly in the stock market. If the entire quantity cannot be executed right away, any remaining unfilled portion is cancelled—there’s no pending order left in the system. This zero-duration order is perfect for those who need rapid decision-making in fast-moving markets.
Key Characteristics of IOC Orders
Advantages of Using IOC Orders
Drawbacks of IOC Orders
Practical Example
Suppose you want to buy 1,000 shares of Company Y at ₹200 each. The market only has 600 shares available at that price.
When to Use IOC Orders
Comparison: IOC vs. Other Order Types
|
Order Type |
Duration |
Fills/Partial Fills |
Pending Risk |
Suitability |
|
IOC |
Immediate |
Yes |
None |
Fast trades, volatility |
|
Day Order |
Until market close |
Yes |
Possible |
Waiting for target price |
|
Fill or Kill (FOK) |
Immediate |
No, must be full |
None |
All-or-nothing trades |
|
Good Till Cancelled (GTC) |
Until executed/cancelled |
Yes |
Yes |
Medium- to long-term |
Conclusion
IOC orders give Agssl traders the flexibility, rapid execution, and risk management needed for modern markets. They’re best for users who value instant action and are comfortable with partial fills, especially in volatile environments or when handling large volumes.
For effective use, understand your trading goals, market liquidity, and risk tolerance—this will help you decide when an IOC order is the right tool for your investment strategy
What Is SIP Investment and How Does It Work? A Complete Guide by AGSSL
What Is SIP in Mutual Funds?
A Systematic Investment Plan (SIP) is a method of investing in mutual funds where an investor opts for a mutual fund scheme and invests in it at fixed intervals.. A SIP investment plan works by investing a small amount of money over time rather than investing a one-time huge amount that could result in higher returns..
How Does a SIP Work?
Once you opt into a systematic investment plan, the amount will be automatically debited from your bank account and reinvested in a mutual fund you purchase at some predetermined time interval.. By the end of the day, you will be allocated units of your mutual fund that depend on its net asset value..
With every investment into an SIP plan in India, any additional units will be added to your account as per the market rate.. With every investment that is made, the amount that you reinvest will be larger in addition to any of the returns that you see on those investments.. The investor decides whether or not to receive the returns at the end of the SIP's tenure or any periodic intervals..
Understanding SIP Through an Example
Assume that you want to invest in a mutual fund of your choice and set aside a sum of ₹. lakh to invest.. There are two ways to make this investment:
Let's say you choose ₹500 monthly SIP with current Net Asset Value (NAV) of ₹.00.:
|
Month |
Investment Amount (₹) |
NAV |
Units Allotted |
Total Units |
|
0 |
500 |
.00 |
5 |
5 |
|
. |
500 |
.25 |
4 |
9 |
|
2 |
500 |
.00 |
5 |
.4 |
|
3 |
500 |
200 |
2.5 |
.6.5 |
₹500 will be deducted from your account each month and automatically credited into the mutual fund at a fixed date every month.. This process continues for the duration you have selected for your systematic investment plan..
Types of Systematic Investment Plans
Top-up SIP
This type enables you to increase your investment amount periodically while giving you the flexibility to invest more when you have a higher income.. It helps make the most out of investments by investing in high-performing funds at regular intervals..
Flexible SIP
As suggested by its name, this type carries the flexibility of the amount you want to invest.. The amount can be increased or decreased based on an investor's cash flow and needs or preferences..
Perpetual SIP
This type enables you to carry out your investments without any end to the mandate date.. Generally, a systematic investment plan carries an end date after one year, three years, or five years of investing..
Benefits of SIP Investing
Makes You a More Disciplined Investor
In case you do not possess superior financial knowledge about market movements, an SIP can make the ideal investment option.. You need not spend time analyzing market movements to find the right time to invest.. With an SIP, your money is automatically deducted from your linked bank account and goes towards your mutual funds..
Rupee Cost Averaging
One of the main advantages of SIPs is rupee cost averaging.. Since the amount you invest remains constant for a longer time period, you can make the most of market volatility.. The fixed amount implies that your SIP will average out the value of each unit, allowing you to buy more units when the market is low and fewer units when the market is high..
Power of Compounding
SIPs allow the small amount you invest on a regular basis to grow into a large corpus as a sum of your contribution with returns that have compounded over the years.. The power of compounding without the hassle of having to invest a lump sum amount gives SIPs a unique advantage over standard investment options..
When To Invest in SIP?
Investing in SIPs can be a strategic decision that aligns with your financial goals and risk tolerance.. SIPs are well-suited for individuals with a long-term investment horizon who want to benefit from the power of compounding..
If you have specific financial goals like buying a house, funding your child's education, or planning for retirement, starting a SIP early allows you to accumulate wealth gradually over time.. Market conditions should not be the sole determinant for starting an SIP since they involve regular and disciplined investing that helps smooth out the impact of market volatility through rupee-cost averaging..
How To Choose a Good Mutual Fund for SIP?
The answer lies in identifying why you are investing and what the goal is.. Consider these factors:
Rather than focusing on a "best" mutual fund for SIP, focus on what fund aligns with your investment principles and timeframe.. No best fund suits everyone; there is only what is best for you..
Best Performing Mutual Funds
|
Name |
AUM (₹ in crore) |
Expense Ratio |
CAGR 3Y (%) |
CAGR 5Y (%) |
|
ICICI Pru Overnight Fund |
.0,098.72 |
0.. |
.25.88 |
65.97 |
|
Quant Small Cap Fund |
..,206.76 |
0.77 |
46.6. |
33.74 |
|
Bank of India Small Cap Fund |
8.9.5. |
0.87 |
35.54 |
32.60 |
|
Quant Infrastructure Fund |
.,.30.39 |
0.77 |
4..92 |
32.04 |
|
Quant ELSS Tax Saver Fund |
4,956.53 |
0.76 |
35.0. |
30.89 |
Note: The list of best performing SIP mutual funds are as of January ., 2024 and are selected based on the 5-year CAGR..
How To Invest in SIP With AGSSL?
You can easily start a Mutual Fund SIP on the AGSSL app by taking the following steps.:
SIP Frequency Options
There are different frequencies available for SIP investments.:
Points to Consider While Selecting SIP Frequency
Common Myths About SIPs
Not for Large Investors
Myth: SIP plans are only for small investors..
Reality: SIP has more to do with frequency of payments than total amount. Anyone can invest up to ₹. lakh provided KYC is completed..
Don't Invest When Market is Bullish
Myth: You shouldn't invest in SIP during bull markets..
Reality: SIP relies on rupee cost averaging which works well over the long term, regardless of market conditions..
SIPs Are Not Flexible
Myth: SIP investments cannot be changed or discontinued..
Reality: SIP is among the most flexible investment instruments available. You can easily alter the amount and tenure with no penalties for changes..
Returns Are Guaranteed
Myth: SIP investments guarantee profitable returns..
Reality: While no investment can guarantee returns, SIPs stand a better chance of earning returns through rupee cost averaging over longer periods..
Only for Equity Markets
Myth: SIPs only invest in equity stocks..
Reality: You can choose which kind of security to invest in through your SIP plan based on your goals and risk profile..
Tax Benefits of SIP
Tax benefits on SIP depend on the type of fund.. SIPs invested in Equity Linked Savings Scheme (ELSS) funds are eligible for tax deductions.. As per Section 80C of the Income Tax Act, investors are eligible for a deduction of up to ₹..5 lakh..
Conclusion
SIPs are useful instruments, especially for investors who want to invest periodically in small amounts.. However, before you invest in an SIP, make sure you have the minimum knowledge about both the stock market and the strategy of the fund managers..
Is SIP suitable for beginners? Yes, SIP is suitable for beginners as it allows gradual investment, doesn't require a lump sum, and provides a disciplined approach to wealth creation.. The minimum investment can range from as low as ₹.00 to ₹500 or more, depending on the mutual fund scheme you choose..
Open a Demat Account with AGSSL today and learn about stocks, SIPs, mutual funds, and more investment opportunities to build your wealth systematically.
Understanding the Difference Between Savings and Investment (agssl)
The Importance of Savings in Indian Households
Many Indians are taught from childhood the value of setting aside money. Whether through a piggy bank, traditional post office schemes, recurring deposits, or fixed deposits, the notion of “saving for the future” is deeply embedded in the national psyche. The focus has always been on security—keeping money safe for emergencies or future needs.
What Exactly Is Saving?
Definition:
Saving means intentionally not spending a portion of current income so it is available for future use.
Where Savings Are Held:
Characteristics:
What Does Investing Mean?
Definition:
Investing is using your money to purchase assets expected to grow in value or generate income over time.
Where to Invest:
Characteristics:
Key Differences: Savings vs. Investment
|
Aspect |
Savings |
Investment |
|
Risk |
Very low; principal is safe |
Moderate to high, depending on instrument |
|
Returns |
Low (3–6% annually) |
Moderate to high (can be 10–12% or more) |
|
Liquidity |
High; easy to withdraw or access |
Varies; some are less liquid |
|
Time Horizon |
Ideal for short-term needs and emergencies |
Best for long-term objectives |
|
Purpose |
Safety, security, short-term goals |
Wealth building, outpacing inflation |
Why Not Just Rely on Savings?
The Hidden Threat: Inflation
Inflation reduces the purchasing power of your money over time. If your savings grow slower than inflation, the real value of your money decreases.
Example:
When Should You Focus on Saving?
Remember:
Emergency funds are best kept in pure savings—easy to access and no risk of loss.
When Should You Prefer Investing?
How Should You Balance Savings and Investment?
Rule of Thumb: The 50-30-20 Approach
Adjustments:
As your income grows or as life situations change, reallocate your proportions. Always prioritize building an emergency fund first, then gradually increase your investment allocation.
Major Pitfalls to Avoid
Final Takeaways
By applying these principles and regularly reviewing your financial plan, you'll harness both safety and growth, laying a solid foundation with agssl for your financial future.
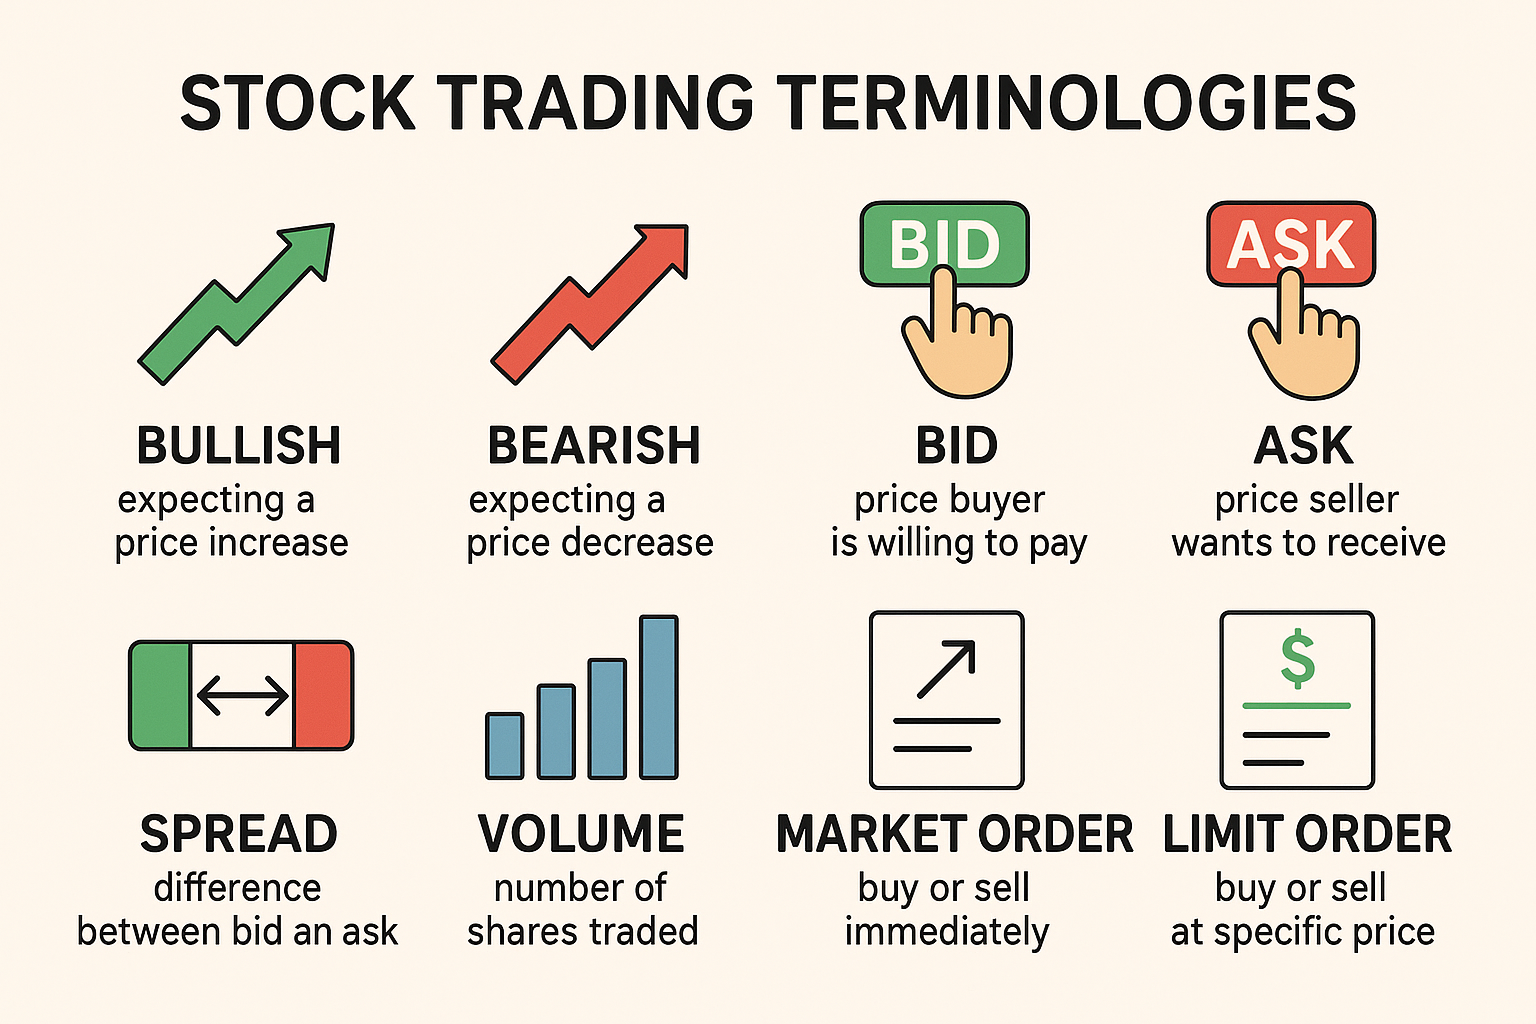
Stock Trading Terminologies
Margin Amount
Margin Funding
Contract Note
Settlement Types
Rolling Settlement
Account Period Settlement
Corporate Actions
Dividend
Bonus Issue
Stock Split
Rights Issue
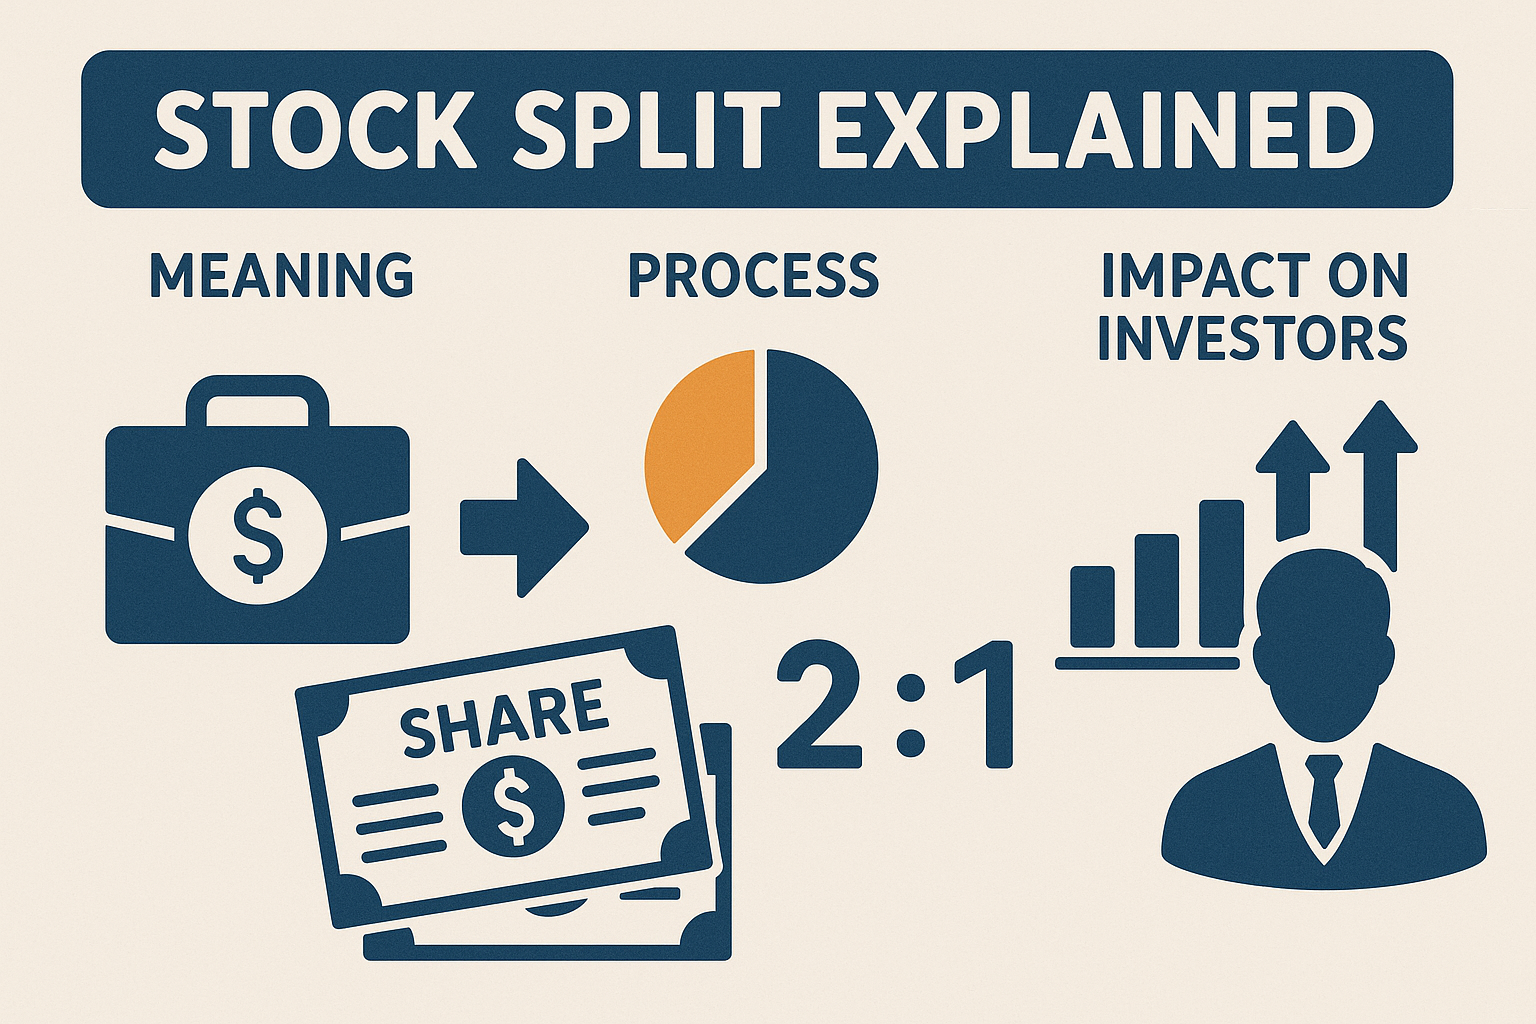
Stock Split Explained: Meaning, Process, and Impact on Investors
When you start learning about the stock market, you’ll come across terms like bonus issues, buybacks, dividends, and stock splits. Among these, a stock split often raises curiosity because it changes the way a company’s shares are priced and traded—yet the company’s overall valuation remains the same.
This article explores what a stock split is, why companies choose this route, how it impacts investors, and the difference between stock splits and reverse stock splits.
What is a Stock Split?
A stock split is a corporate action in which a company divides its existing shares into multiple smaller shares. The face value of each share decreases, while the number of shares increases proportionally.
Despite this change, the company’s overall market capitalization remains the same.
Think of it like exchanging a ₹2,000 note for four ₹500 notes—you have more notes in hand, but the total value of money remains unchanged.
Example of Stock Split
Imagine you hold 10 shares of a company priced at ₹900 each.
Before a 1:2 split
After a 1:2 split
In this case, the share count doubled, and the price halved, but your overall investment value remains unchanged.
Another case: 1:5 split
Why Do Companies Split Their Shares?
Companies announce stock splits for several reasons:
Key Dates in a Stock Split
Two dates play a crucial role in any stock split:
Shares are credited to investors’ demat accounts with a new ISIN (International Securities Identification Number) on the trading day following the record date.
Impact of Stock Split on Futures and Options (F&O)
Stock splits also affect derivative contracts. To maintain fairness, adjustments are made to both price and lot sizes.
This ensures that the overall contract value remains unchanged.
Example:
If a company trades at ₹4,000 with a lot size of 25, and it undergoes a 1:5 split:
Real-Life Case: IRCTC Stock Split
In October 2022, IRCTC announced a 1:5 stock split. Before the split, shares traded near ₹4,500. Post-split, they adjusted to about ₹900.
This made IRCTC’s stock more affordable and significantly boosted liquidity in the market, allowing more retail investors to participate.
Reverse Stock Split (Share Consolidation)
The opposite of a stock split is a reverse split, also known as consolidation. In this process, multiple shares are combined into one, which raises the face value and share price while reducing the number of outstanding shares.
For example, in a 2:1 reverse split:
Reverse splits are often undertaken when a stock price has dropped too low, and the company wishes to improve its market image or comply with exchange regulations.
Advantages and Disadvantages of Stock Splits
Advantages
Disadvantages
Conclusion
A stock split increases the number of shares in circulation while reducing their face value and market price. The total value of an investor’s holding remains unchanged.
While stock splits make shares more affordable and improve liquidity, they do not alter the company’s underlying fundamentals. Investors should see stock splits as a cosmetic adjustment for accessibility, not as a guarantee of higher profitability.
Ultimately, long-term success still depends on the company’s business model, earnings growth, and market position.
“What is an ETF in the stock market and how does it work?”
An Exchange Traded Fund (ETF) is one of the most popular investment options among both investors and traders. An ETF is a type of fund that owns a collection of securities such as stocks, bonds or commodities, and it trades on a stock exchange just like a share.
The biggest advantage of ETFs is that they combine the features of both stocks and mutual funds. Like a stock, you can buy and sell ETFs throughout market hours at live prices, which is known as ETF trading. Like a mutual fund, they provide diversification by pooling together many securities in one basket. This makes them flexible, transparent and cost-efficient.
For instance, one of the most well-known ETF examples in India is the Nippon India ETF Nifty BeES. It mirrors the performance of the Nifty 50 index, which means buying one unit of this ETF gives you exposure to all 50 companies in the index. Similarly, globally, the SPDR S&P 500 ETF (SPY) is one of the most traded ETFs in the United States, tracking the S&P 500 index. These examples show how ETFs give instant diversification with a single transaction.
Investors often compare ETF vs mutual fund. Mutual funds are priced only once at the end of the trading day, while ETFs can be traded instantly on the exchange. ETFs usually have lower expense ratios than mutual funds and publish their holdings daily, which adds transparency. Many new investors search “Are ETFs good for beginners?” The answer is yes, because ETFs allow even small investments to gain exposure to a wide portfolio without buying individual stocks one by one.
Still, no investment is risk-free. Traders often search “ETF benefits and risks”. The main benefit is low cost, diversification and liquidity. The risk is that ETFs are market-linked, so their value can go up or down with the broader economy. Some ETFs also focus on specific sectors or commodities, which may be more volatile.
In short, ETFs provide the convenience of stock trading and the diversification of mutual funds. For those searching “best ETF for investment in India”, the choice depends on goals and risk profile. Equity ETFs, debt ETFs and gold ETFs are some of the most common categories that help investors build a balanced portfolio.